Blog
Flu, COVID-19, and RSV in the U.S.: Insights from the Latest Surveillance Season

July 31, 2024
Welcome to 2023-2024 season’s respiratory surveillance recap, where we’ll share insights from the most recent respiratory surveillance season, covering three major respiratory viruses: COVID-19, influenza, and RSV. Tracking these illnesses is imperative for maintaining population health because these illnesses significantly impact individual wellbeing and healthcare costs, resource allocation for vaccination and treatment, health messaging strategies, and hospital capacity planning, among others. Overall, the 2023-2024 respiratory season looks similar to what we observed last season. COVID-19 remains the largest source of viral respiratory-related hospitalizations and deaths, followed by influenza, and then RSV. Notably, wastewater has proven to be an effective early warning indicator for all three viruses, providing signals of increases several weeks in advance (CDC RESP-NET, CDC Severe Viral Respiratory Illness dashboard).
Wastewater Data
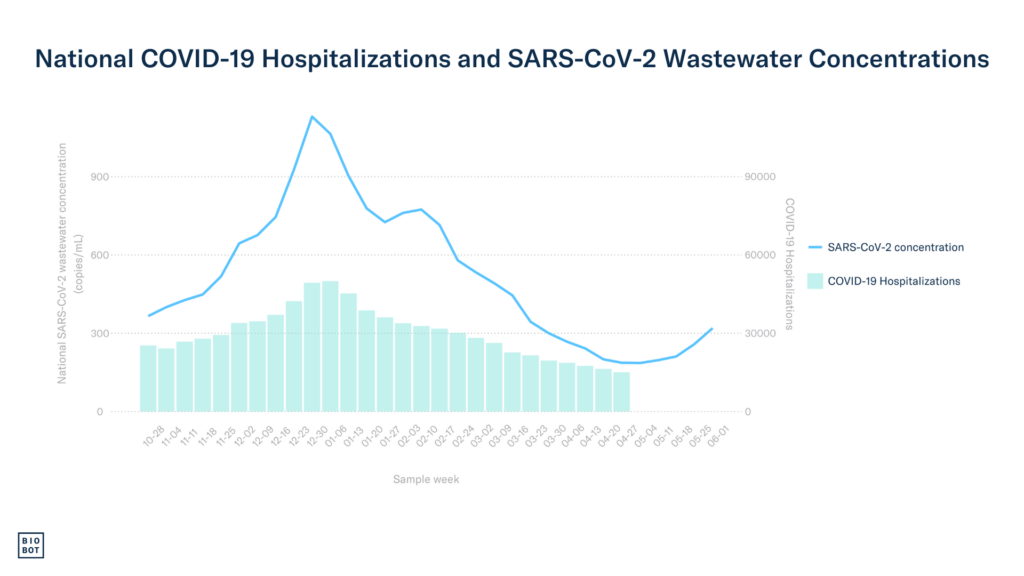
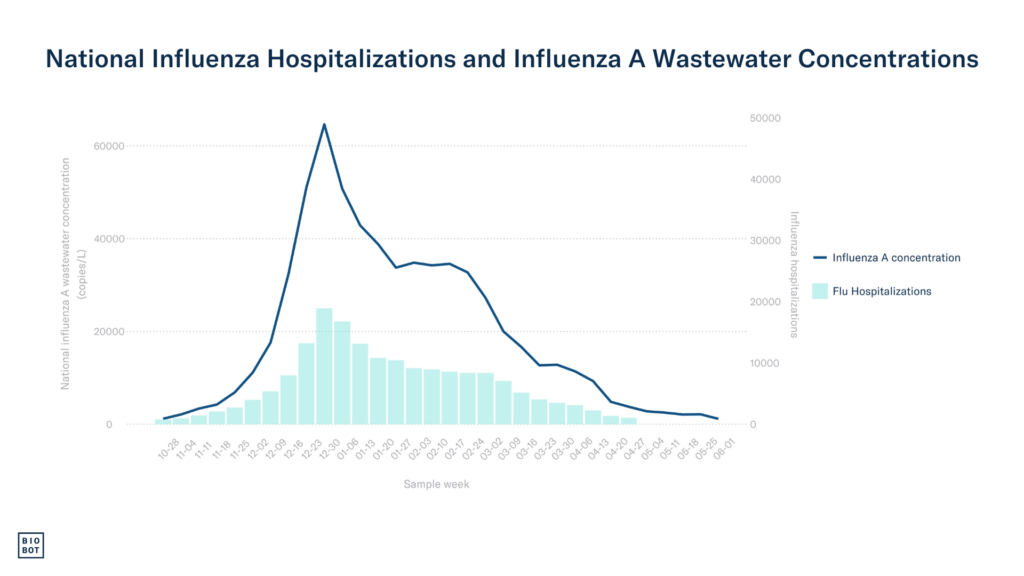
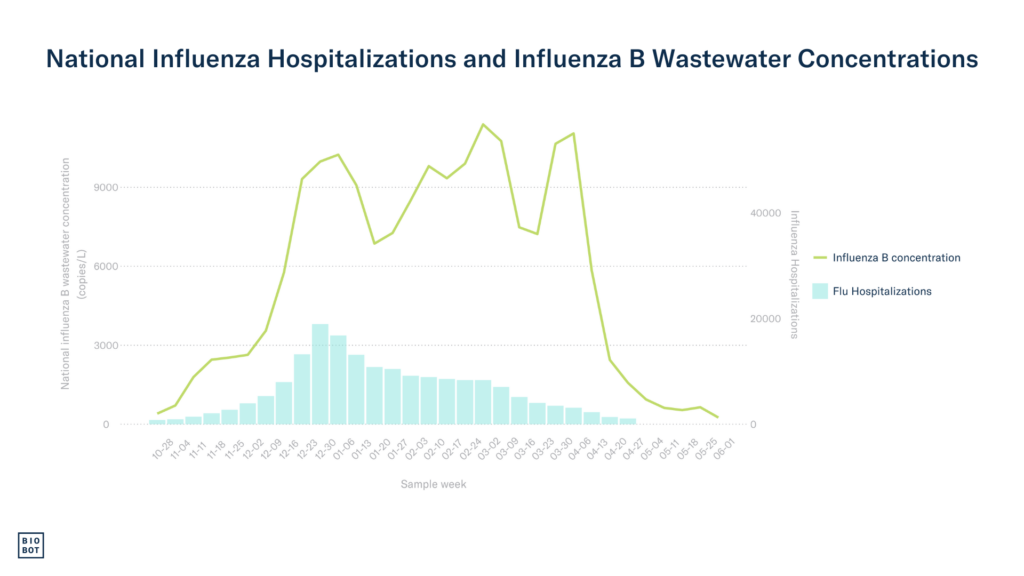
This was the first respiratory illness season Biobot collected data for all three major respiratory viruses: SARS-CoV-2, influenza A & B, and RSV. We began testing wastewater samples for influenza virus A & B and RSV in late October 2023. As data were analyzed, we shared national and regional average concentration trends through our weekly Respiratory Report blog series. It has consistently been found that SARS-CoV-2 wastewater concentrations are a leading indicator for increases in COVID-19 hospitalizations by one to four weeks(1). To understand how influenza and RSV wastewater concentrations compare to clinical data, we calculated Spearman’s correlation coefficients for national population-weighted wastewater concentrations and national hospitalization data for influenza and RSV, in addition to SARS-CoV-2. These analyses were done retrospectively at the end of the season, and do not account for real-time reporting delays in hospitalization data, which are consistently delayed by at least one week, and often two. COVID-19 and influenza hospitalization data were obtained from the National Hospitalizations Safety Network prior to May 1st, 2024 when the CDC discontinued mandatory hospitalization reporting. National RSV hospitalization rates were obtained from the CDC RSV-NET surveillance system.
During the 2023-2024 respiratory illness season, wastewater concentration data proved to be a leading indicator of viral activity for all three viruses. These data provided early warnings, showing strong correlations with clinical data and detecting increases in viral activity weeks in advance. Nationally aggregated SARS-CoV-2 wastewater concentrations were highly correlated with national COVID-19 hospitalizations two weeks later, with a Spearman’s correlation coefficient of 0.86. The correlation coefficient between wastewater and hospitalizations the same week was 0.83. State-level increases in SARS-CoV-2 wastewater concentrations gave a median early warning of two weeks before rises in COVID-19 hospitalizations, with many states experiencing lead times of three to six weeks. Biobot’s wastewater data also tracked the rapid spread of the JN.1 variant, and its subsequent sub-variants, in real-time this season.
Similarly, nationally aggregated influenza A wastewater concentrations were highly predictive of national flu hospitalizations two weeks later, with a Spearman’s correlation coefficient of 0.79. The correlation coefficient between wastewater and hospitalizations the same week was 0.98. At the state level, increases in influenza A concentrations gave an early warning of heightened influenza activity by a median of three weeks before influenza-like illness (ILI) percentages crossed the 3% baseline threshold set by CDC.
Nationally aggregated RSV wastewater concentrations also showed a significant correlation with RSV hospitalization rates two weeks later, with a Spearman’s correlation coefficient of 0.86. The correlation coefficient between wastewater and hospitalization rates the same week was 0.94. Sampling for RSV began in late-October, after many states already had elevated RSV activity. This made it challenging to assess the widespread lead time across states in our network. However, for states that had not yet started their RSV season, increases in RSV wastewater concentrations preceded increases in test positivity and hospitalization rates by two to four weeks.
Clinical Data
Now let’s jump into the clinical data for the latest respiratory season.

The cumulative COVID-19-associated hospitalization rate for this season was 135.6 cases per 100,000 persons, with peak cases clustering around mid-December 2023 through early January 2024. COVID-19-associated deaths for this season indicate that mortality rates have decreased since the 2022-2023 respiratory season, dropping from a peak of 5.60% of deaths due to COVID-19 last season to a peak of 3.80% this season. Unfortunately, as of May 1st, 2024, the CDC no longer requires the reporting of COVID-19 hospitalizations. Without this metric for comparison in future seasons, continuous monitoring of wastewater will become even more vital for understanding the season’s severity.


Moving into influenza, it is estimated that there were around 35 million influenza infections this season, approximately 390,000 flu-related hospitalizations, and around 25,000 deaths. These numbers are slightly higher than last season, which reported 31 million illnesses, 360,000 flu-related hospitalizations, and 21,000 deaths (CDC Influenza Surveillance Report). The 2024 season saw a rate of 81.8 hospitalizations per 100,000 persons, which is the highest it’s been since the 2017 season, during which the hospitalization rate was 102.9 per 100,000 persons.

When considering RSV infections and hospitalizations, one of the few data sources we can evaluate is RSV-related hospitalization rates from the 12 states that participate in the CDC RSV-NET, as not every state mandates RSV as a reportable disease. Available data for the 2023-2024 season reported an overall RSV-associated hospitalization rate of 54.0 cases per 100,000 persons, while the hospitalization rate for the 2022-2023 season was comparable at 53.7 cases per 100,000 persons.
All in all, the clinical COVID-19 burden was slightly better this season compared to last, the influenza burden was slightly worse, and RSV appeared to be very similar to the previous season.
Conclusion
Wastewater data was strongly correlated with clinical data for respiratory illnesses this season, offering early warning signals weeks in advance. Proven to be representative, timely, and accurate, wastewater monitoring technology effectively addresses many limitations of existing health monitoring systems. The potential of wastewater epidemiology for future respiratory illness monitoring is immense, especially as we continue to see metrics like hospitalizations and infection rates phased out from CDC data collection. As we look ahead to the next respiratory season, which begins in just a couple months, wastewater intelligence will continue to play a crucial role in identifying the season’s onset and tracking trends in local community viral activity.
Sources:
- Li X, Liu H, Gao L, et al. Wastewater-based epidemiology predicts COVID-19-induced weekly new hospital admissions in over 150 USA counties. Nat Commun. 2023;14(1):4548. doi:10.1038/s41467-023-40305-x
Written by Oona DiMatteo
Oona is a Master of Public Health candidate in Epidemiology at Tulane University and is currently serving as Public Health Intern at Biobot.


