At Biobot, we analyze wastewater across the country for various infectious disease pathogens....

Respiratory Virus Risk Reports
Comprehensive Insights for COVID-19, Influenza, and RSV
COVID-19, Influenza, and RSV Wastewater Monitoring in the U.S. | Week of November 7, 2025
Throughout the respiratory season, we analyze wastewater for the presence of respiratory syncytial virus (RSV) and influenza virus (types A and B). Together with COVID-19, these three pathogens are outsized contributors to our seasonal respiratory illness burden. In this data series, we’ll guide you through the wealth of data we’ve gathered from our Biobot Network of national sampling sites, aiming to shed light on emerging trends in respiratory virus activity and community viral load. Our goal is to equip you with information to make informed decisions.
Data Note: Samples are collected from participating locations, and processed by our lab team on a rolling basis. Each point on the figure represents the weekly average concentration, from Sunday – Saturday (corresponding to the MMWR week), aligned to that week’s Saturday.
Contributors

Marisa Donnelly, PhD
Public Health Partnerships Epidemiologist
Previous Risk Reports
Share this post
Copied!


Summary: Week of 11/07/25
Biobot’s national wastewater network
shows that RSV continues to slowly pick up in the South through November 7 (week 45). We’re also starting to see some movement with influenza A, indicating the flu season is just beginning. Overall COVID activity is mostly holding steady nationally, though we’re starting to see some small upticks in the South and Midwest.
Due to the government shutdown, the CDC is still not updating their dashboards, so we don’t know the current hospitalization rates for any of the respiratory viruses. They haven’t been updated since September 20th.
The Bottom Line: RSV activity continues to pick up while flu A is showing early signs of activity. Thankfully, COVID is still down.
National Outlook
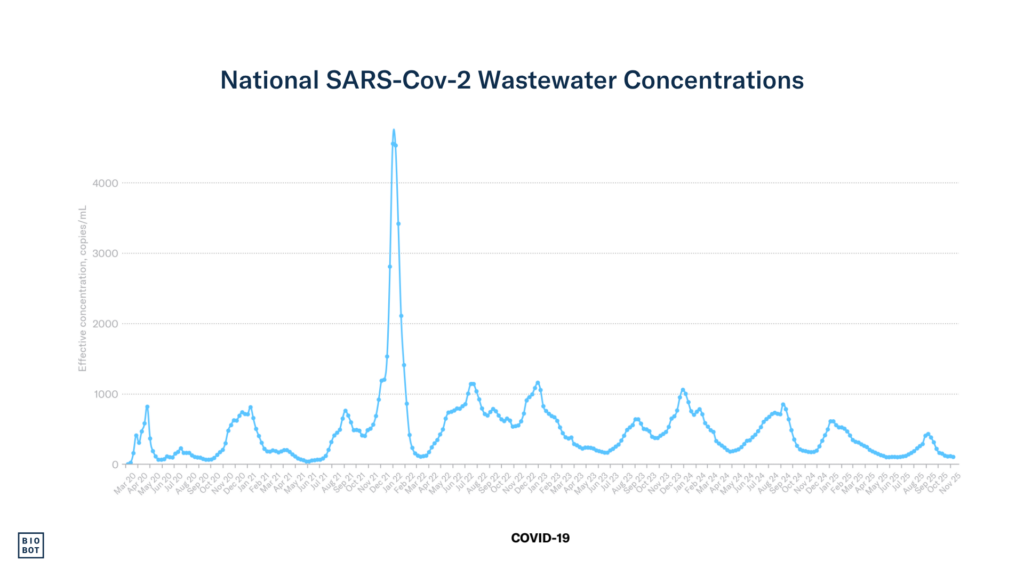
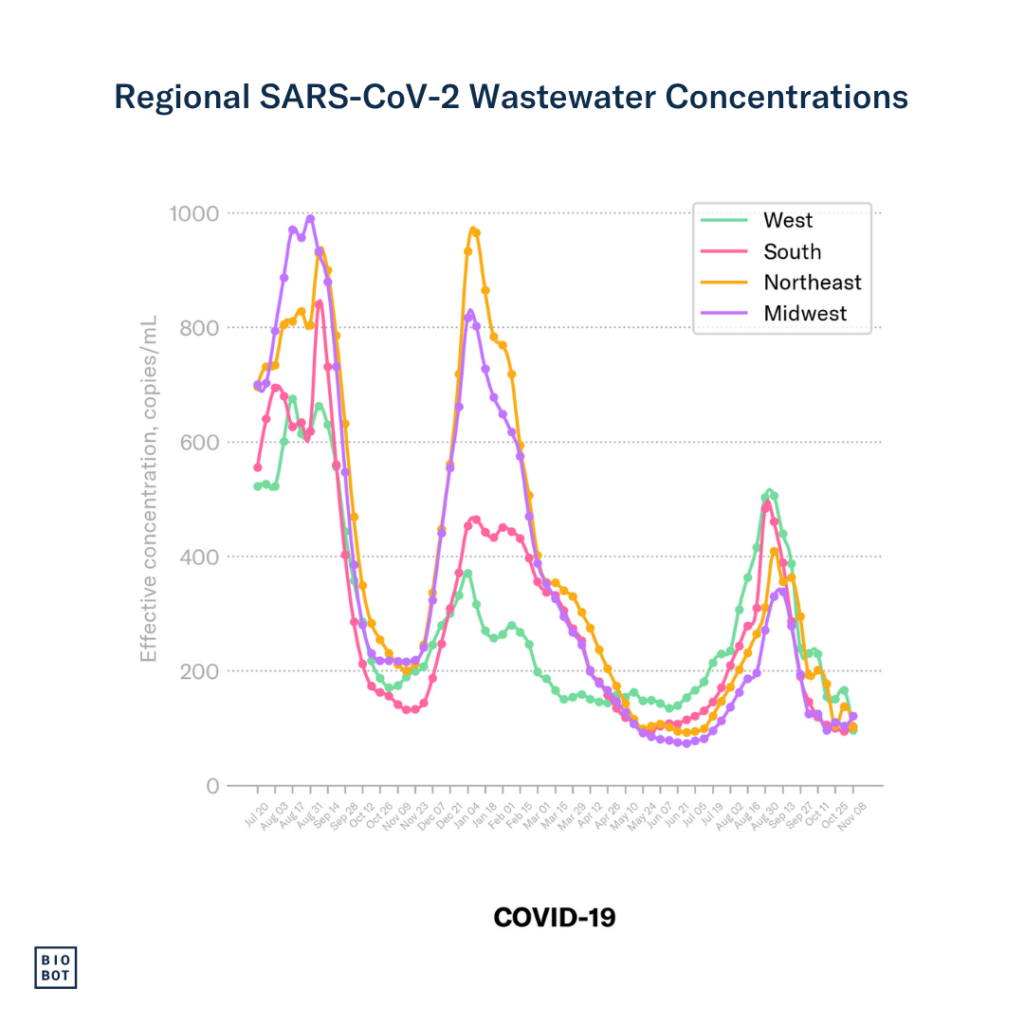
COVID-19
National SARS-CoV-2 concentrations are holding steady at low levels.
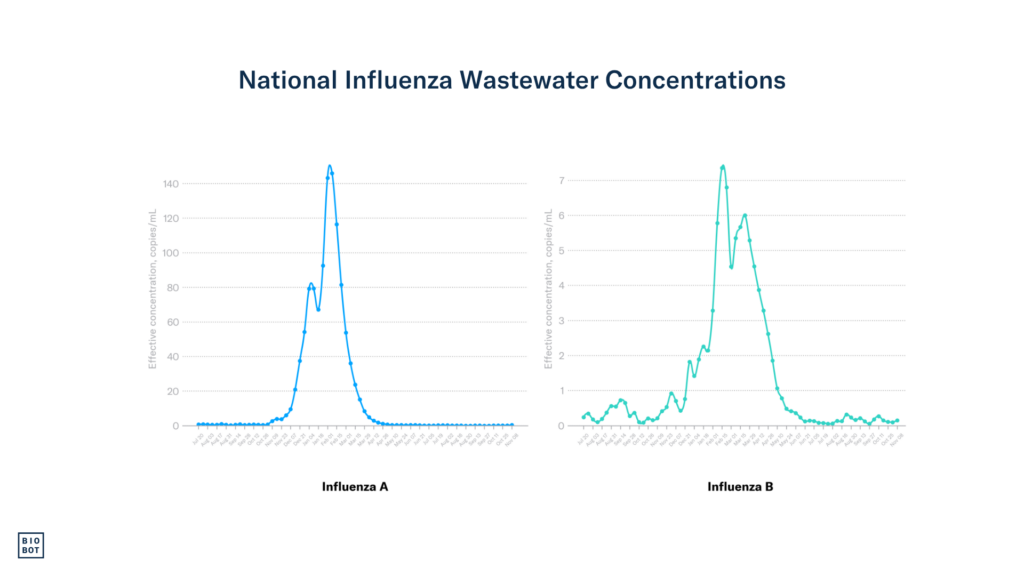
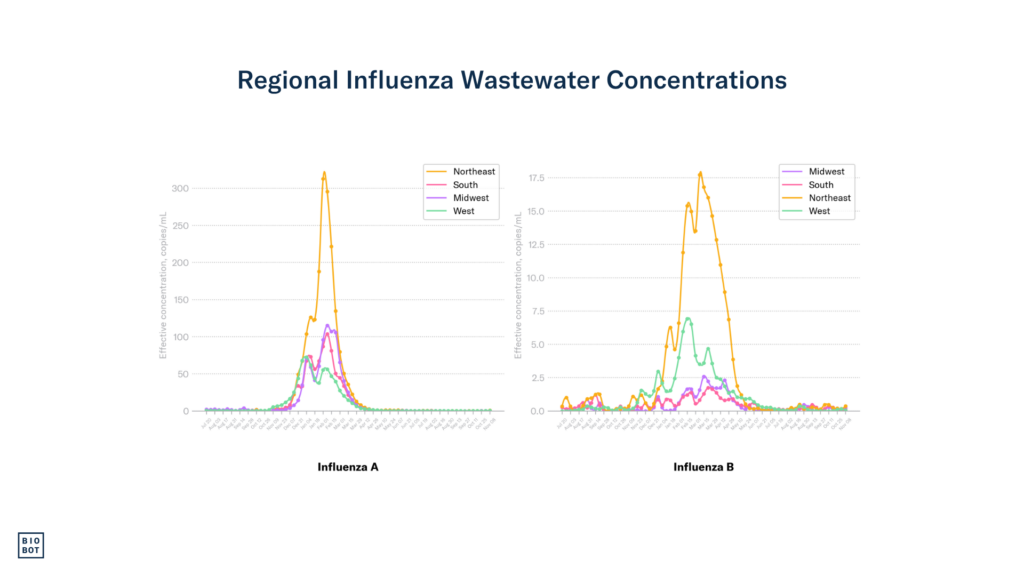
Influenza
National influenza A & B concentrations are slightly increasing.
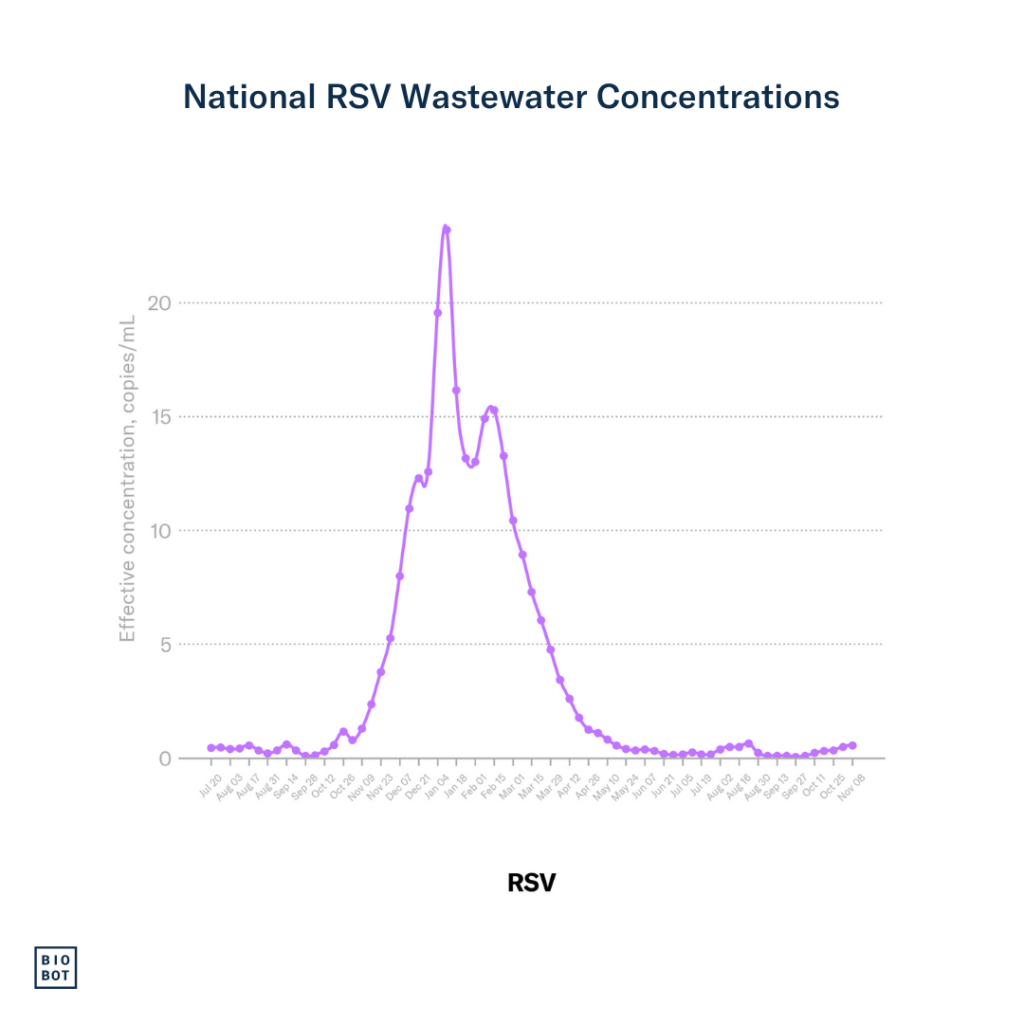
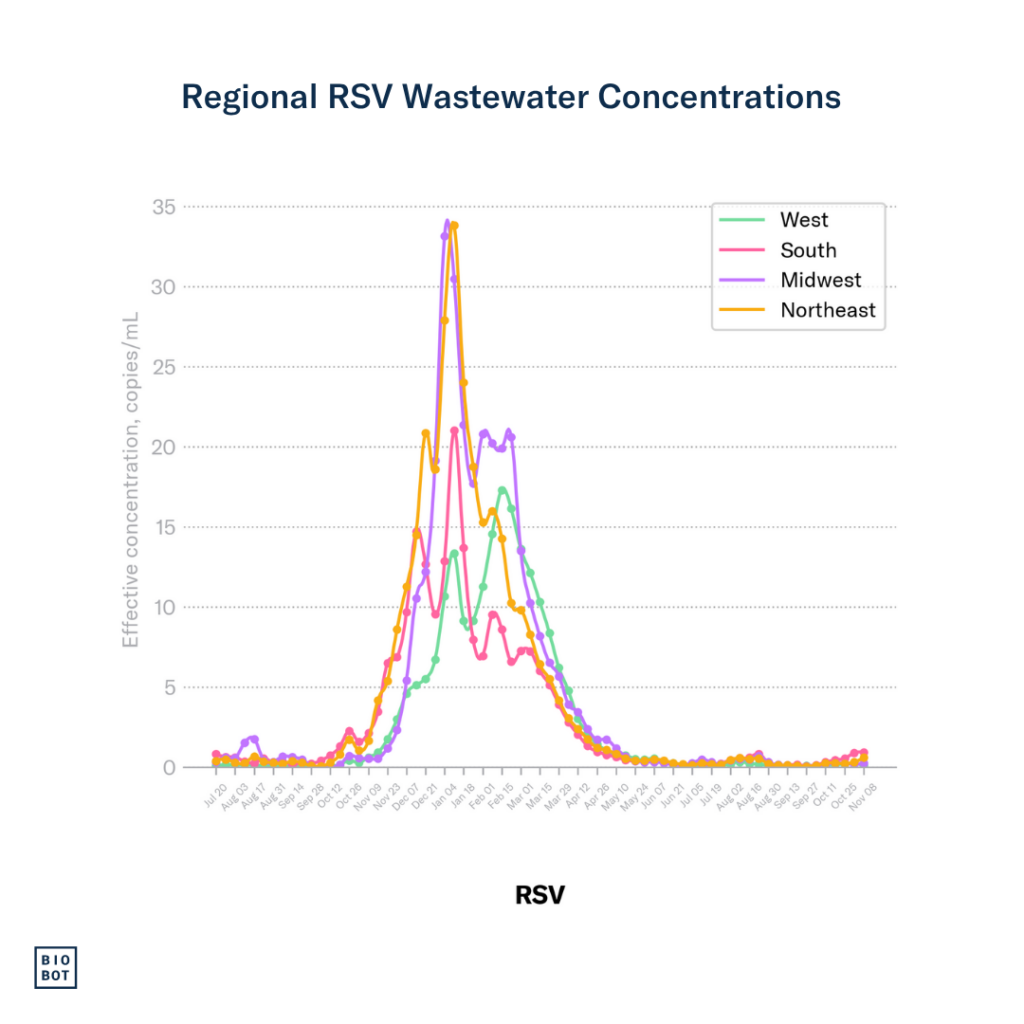
RSV
National RSV concentrations are increasing.
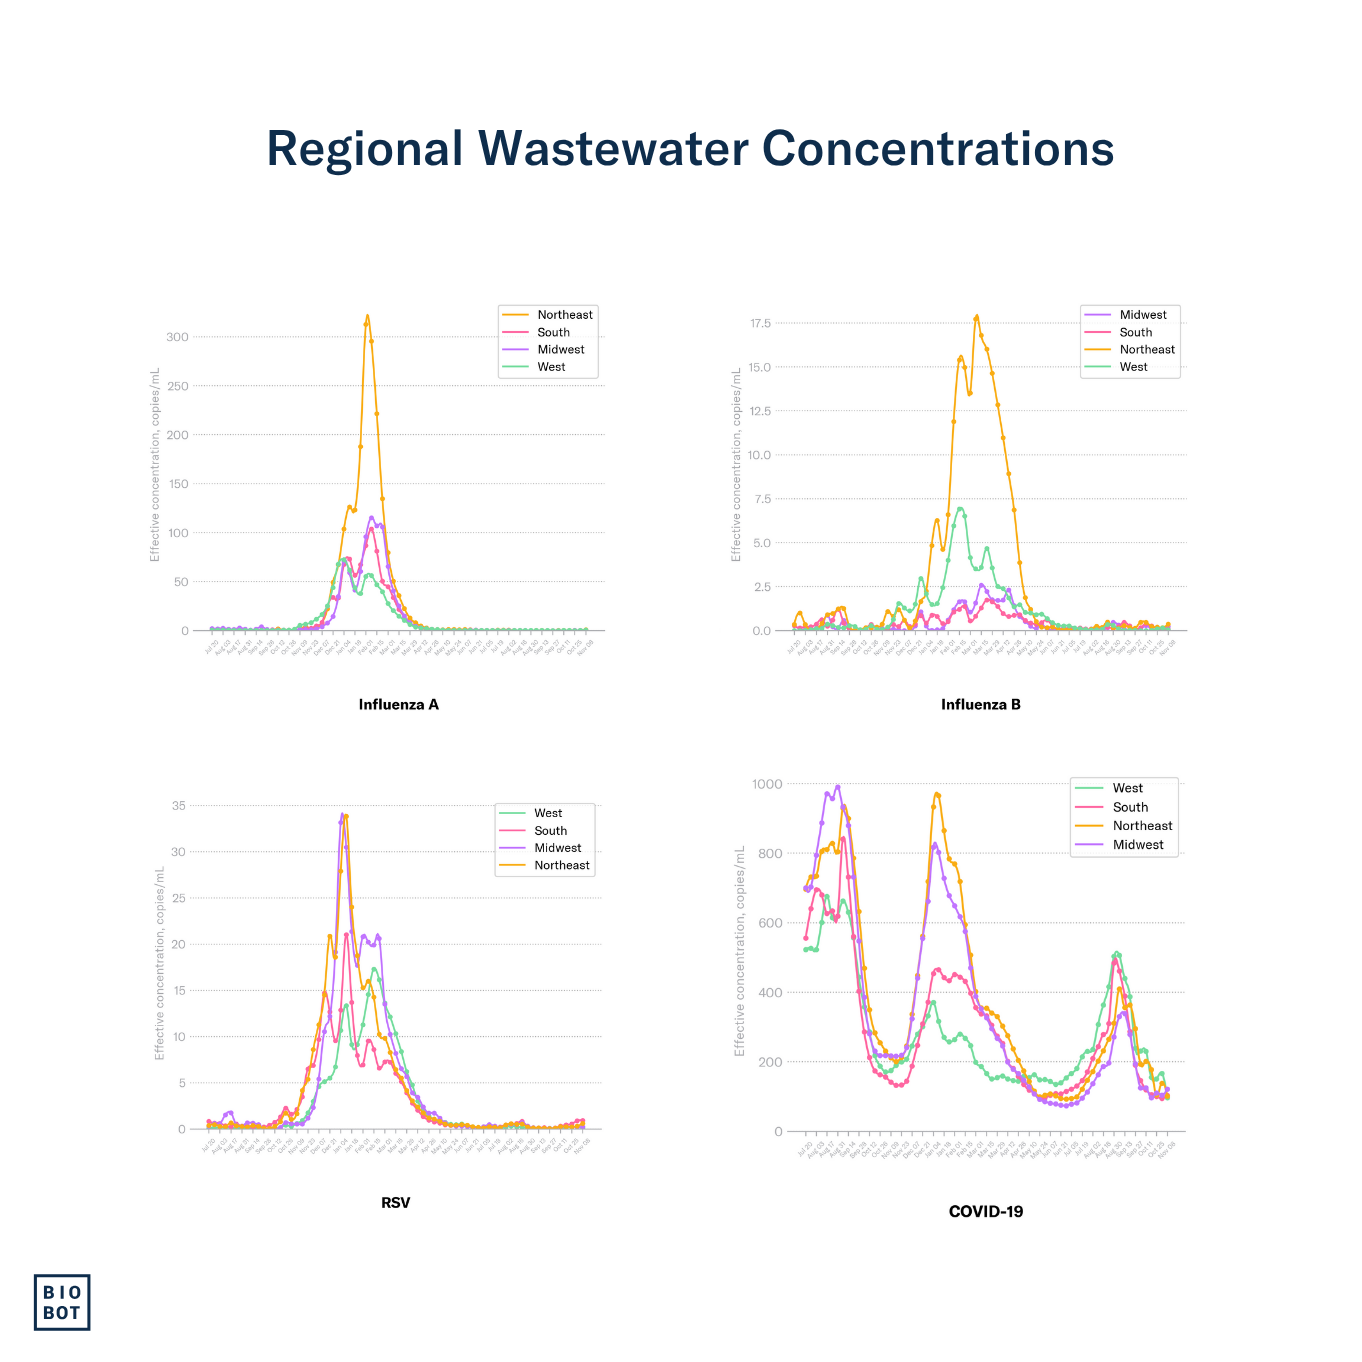
Regional
The South
COVID-19: SARS-CoV-2 concentrations are slightly increasing in the South.
Influenza: Influenza A and B concentrations are slightly increasing in the South.
RSV: RSV concentrations are increasing in the South.
The Midwest
COVID-19: SARS-CoV-2 concentrations are increasing in the Midwest
Influenza: Influenza A concentrations are holding steady in the Midwest, while influenza B concentrations are slightly increasing.
RSV: RSV concentrations are holding steady at very low levels in the Midwest.
The Northeast
COVID-19: SARS-CoV-2 concentrations are decreasing in the Northeast.
Influenza: Influenza A and B concentrations are slightly increasing in the Northeast.
RSV: RSV concentrations are increasing in the Northeast.
The West
COVID-19: SARS-CoV-2 concentrations are decreasing in the West.
Influenza: Influenza A concentrations are slightly increasing in the West, while influenza B concentrations are holding steady.
RSV: RSV concentrations are holding steady at very low levels in the West.
Footnotes:
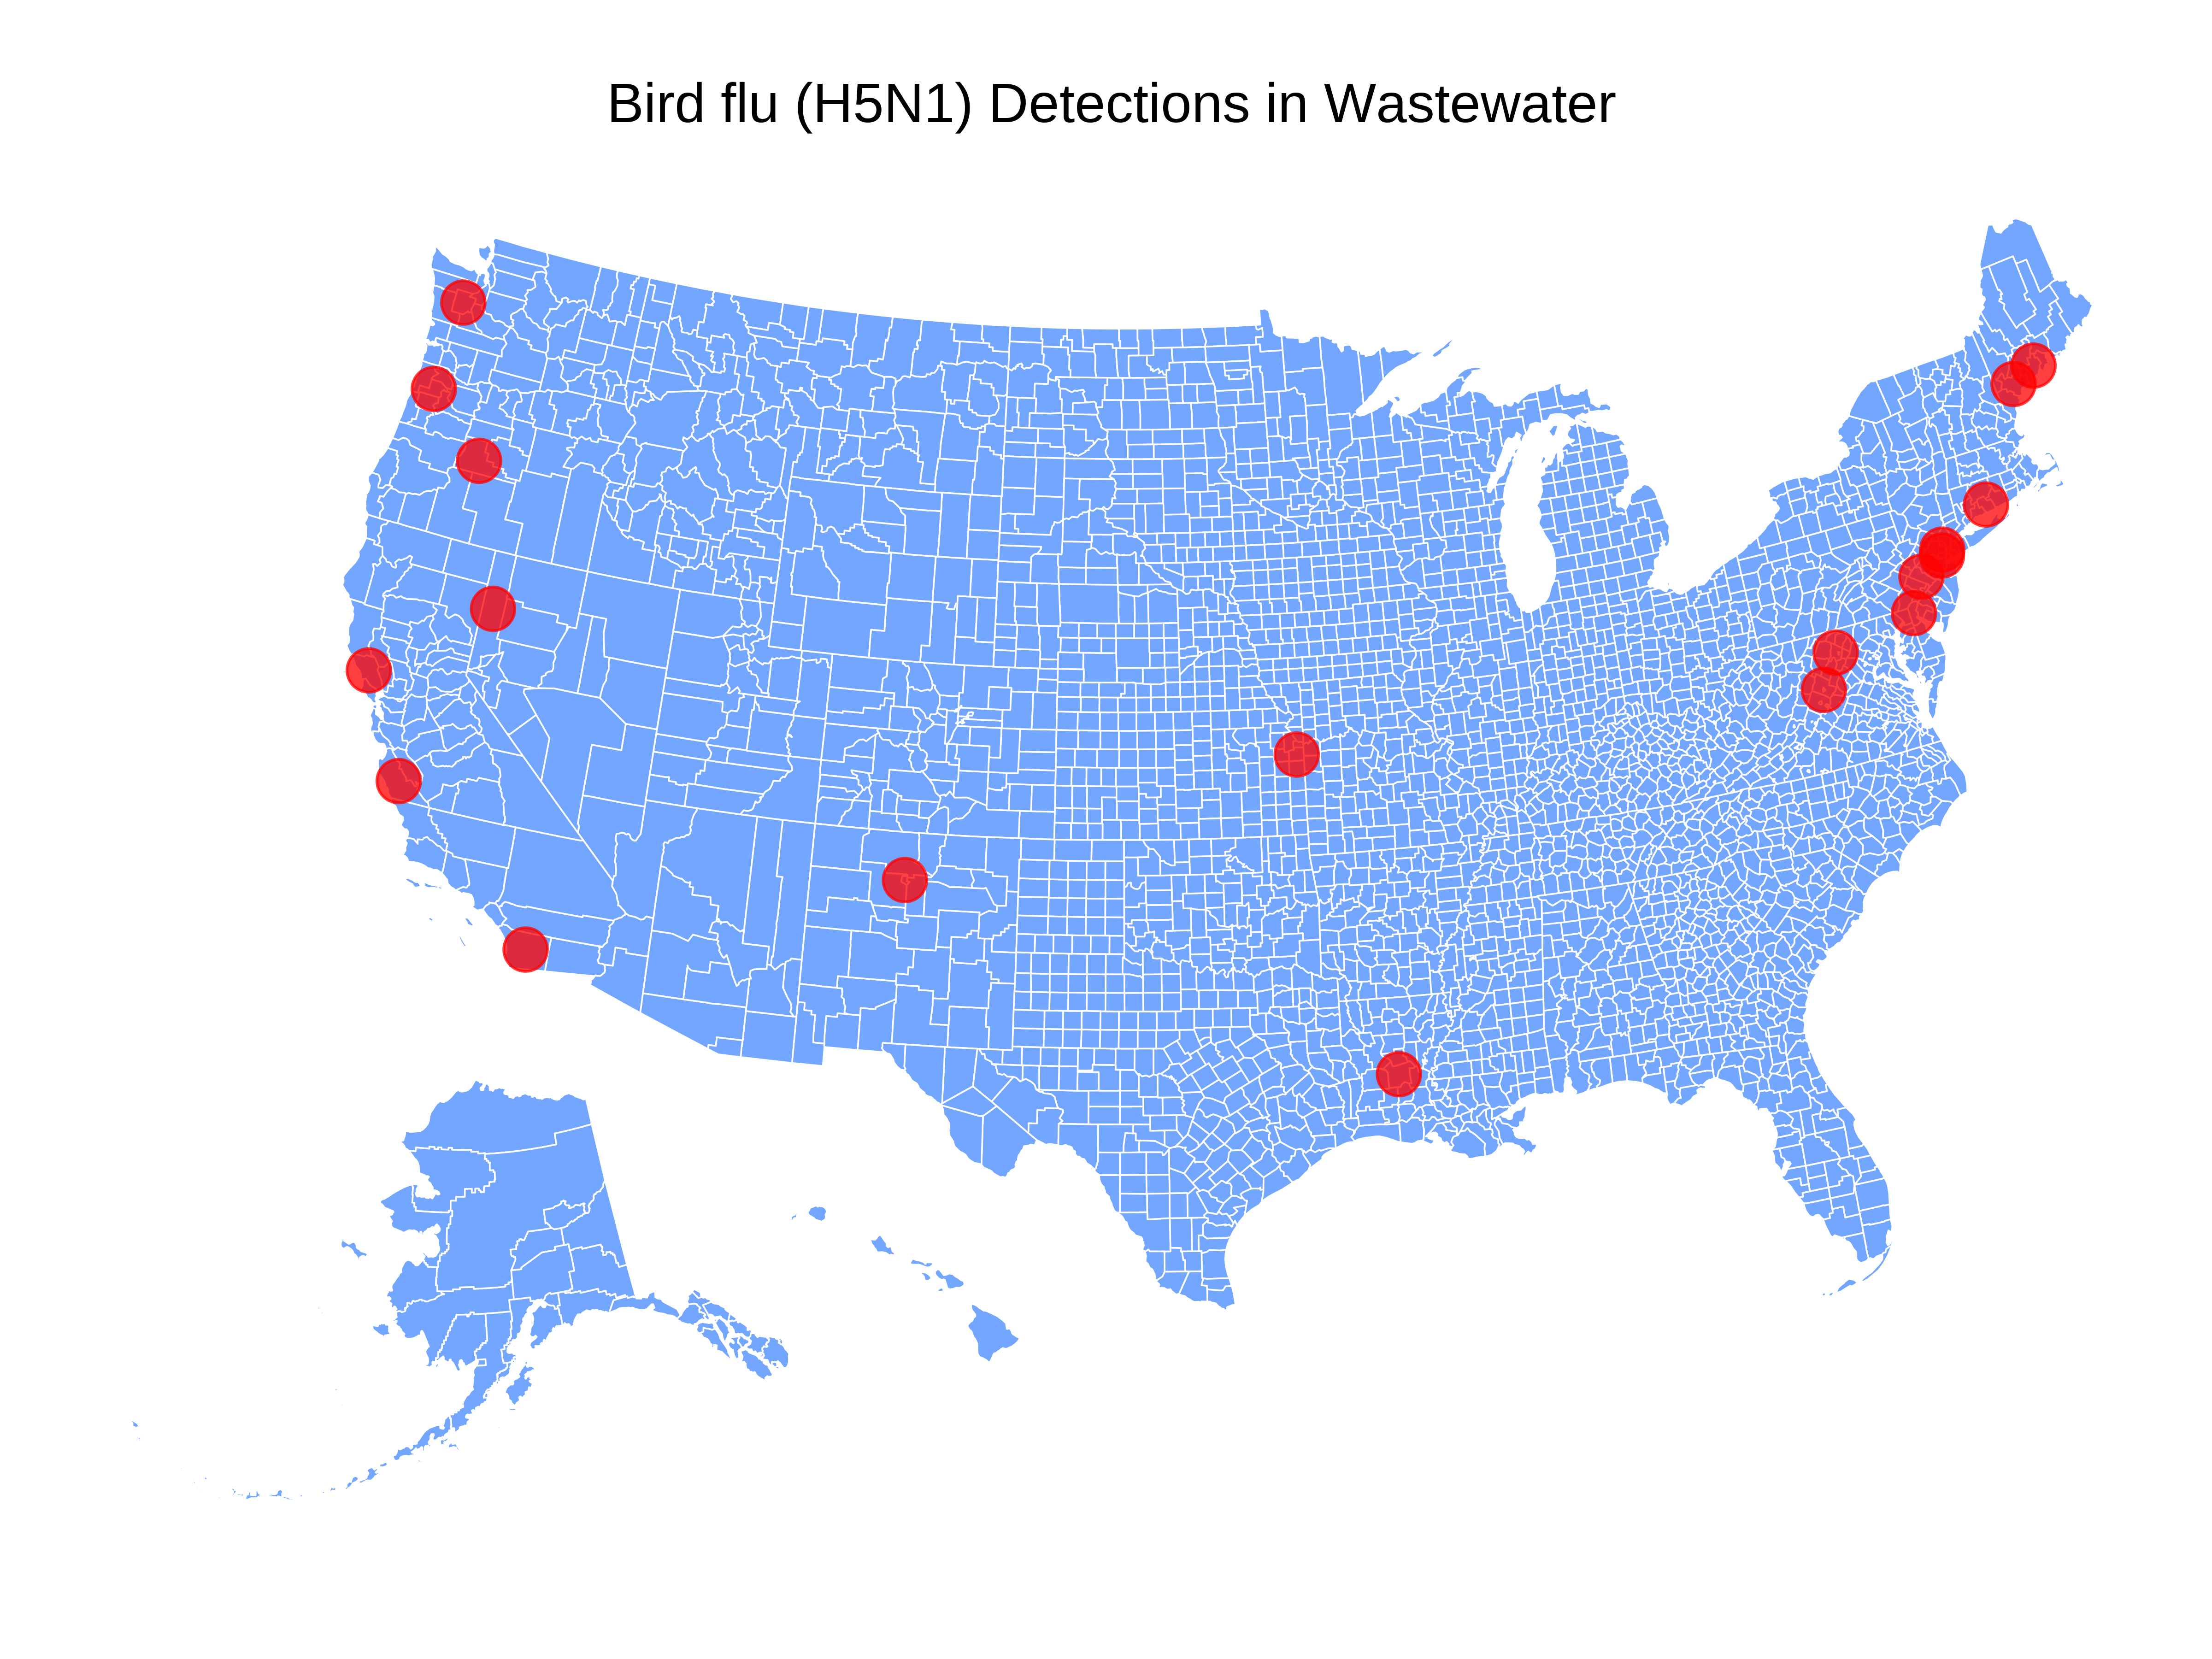
We continue to monitor the evolving H5N1 influenza virus situation, and can now test samples specifically for H5 (including H5N1) — see our blog here and please reach out to hello@biobot.io if interested. A quick reminder that Biobot’s influenza A assay described in this report includes the H5N1 influenza subtype, which is an influenza A virus, but does not distinguish between the different subtypes of influenza A (e.g. H5N1 vs H1N1). We will share any important updates as we have them via Bluesky and in the risk reports.

Wastewater data from Biobot Analytics for RSV, influenza, and SARS-CoV-2 are through November 7, 2025 (MMWR week 45). Clinical data for RSV, influenza, and COVID-19 from the Centers for Disease Control and Prevention have not been updated since September 20, 2025 (MMWR week 38) due to the government shutdown.
Discover the Power of Wastewater
See previous updates and blog posts below.
July 31st, 2024
Flu, COVID-19, and RSV in the U.S.: Insights from the Latest Surveillance Season
Welcome to 2023-2024 season's respiratory surveillance recap, where we’ll share insights from the...

May 17th, 2024
From Raw Data to Actionable Insights: Biobot’s Evolution of Public Data Sharing
Blog update 5/30/24: We want to thank the public for all the love and support of this work over...
