

Summary: Week of 3/18/24
In good news this week, data from Biobot’s national wastewater network and clinical disease monitoring show that RSV and influenza A & B activity are all declining, while SARS-CoV-2 activity remained stable. National average wastewater concentrations for RSV and influenza A & B declined in week 11, while wastewater concentrations for SARS-CoV-2 held steady. Nationally, all major clinical metrics for COVID-19 and RSV showed signs of declining illness burden. Most clinical metrics for influenza also show promising signs of declining activity – however, some remain elevated, indicating that influenza activity is ongoing. Despite some elevated metrics, it appears that we continue to head towards reduced activity for all the major respiratory illnesses.
The Bottom Line: As we get closer to the end of the respiratory virus season, viral transmission and circulation are still ongoing, especially for influenza. It is still an important time to reduce contact with others if you are feeling ill, consider wearing a mask in crowded environments, and keep up to date with vaccines and boosters. Taking these measures can help keep you and your loved ones healthy.
National Outlook
RSV
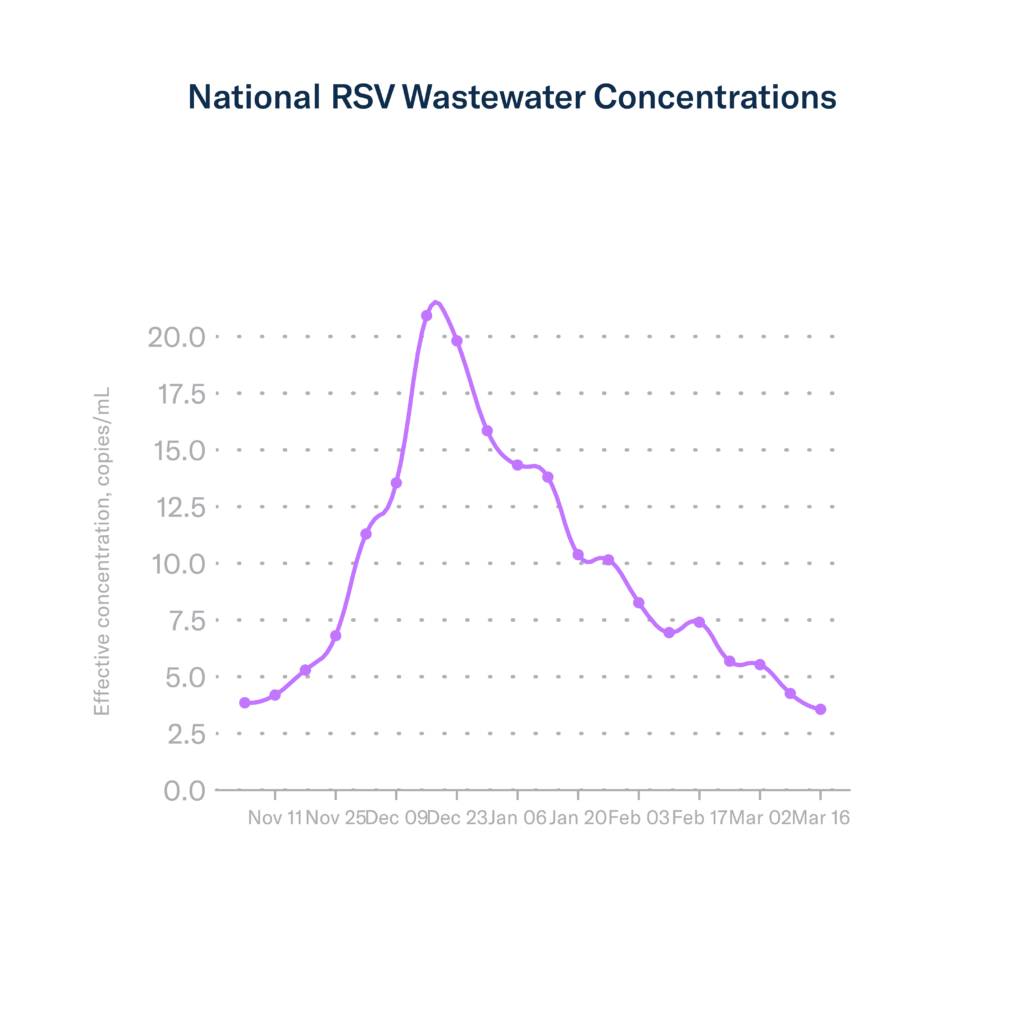
National RSV wastewater concentrations continued declining during week 11 (through March 16th) and are now at levels similar to those observed in early November. These low levels suggest we are very close to the end of the RSV season.
National clinical RSV metrics remained low during week 10 (through March 9). The percentage of positive PCR tests (test positivity) for RSV held steady, going from 3.1% the previous week to 3% in week 10. These test positivity levels are similar to what we observed in early October at the beginning of the respiratory illness season, signaling that current RSV test positivity is low. Hospitalization rates also continue to decline nationally and for all age groups.
Influenza
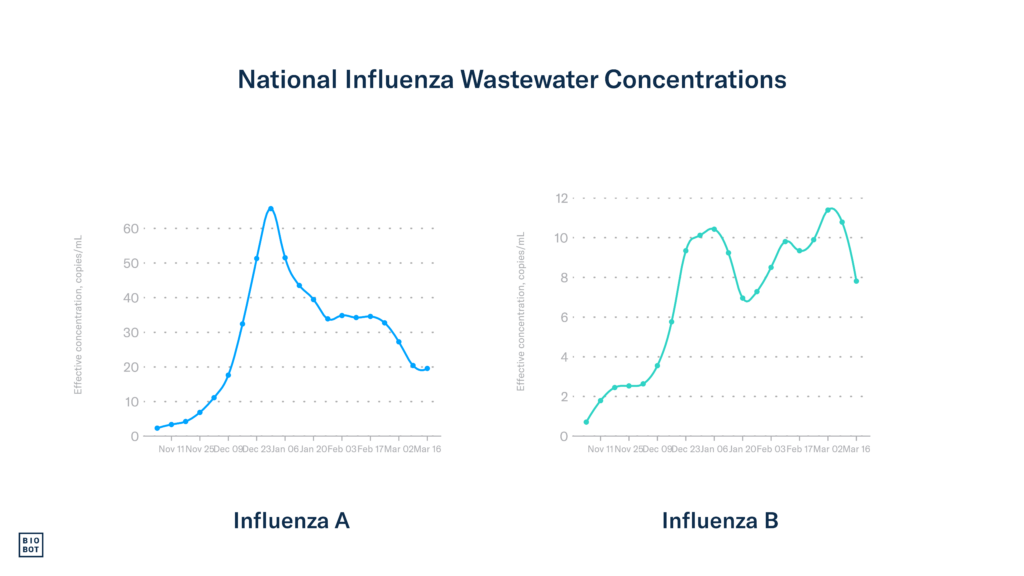
Influenza A wastewater concentrations declined in week 11, albeit only slightly, going down 3.9% compared to the previous week. In good news, influenza B concentrations significantly declined in week 11, down 27.8% compared to the previous week. This suggests that we may have passed the seasonal influenza B peak. Additional data will confirm this in the coming weeks.
Following the decreases in wastewater concentration, we observed in week 10 that two out of three of the major clinical influenza metrics also showed improvement. In good news, the number of hospitalizations decreased, with about 8,800 hospitalizations due to flu during week 10. The percentage of outpatient visits for flu-like symptoms – typical in flu, RSV, and COVID-19 patients – decreased, going from 4.1% to 3.7% in week 10. However, test positivity from clinical labs increased from week 9 to week 10, going from 13.9% to 15.4%. As expected, clinical metrics mostly declined in tandem with declining influenza wastewater concentrations.
COVID-19
Wastewater data show that COVID-19 activity and community viral load stayed constant the previous week. As of week 11, the national SARS-CoV-2 wastewater concentration average is 524 copies/mL. We’ll monitor SARS-CoV-2 wastewater concentrations and hope they begin declining again soon.
In great news, all the major national clinical COVID-19 metrics declined during week 10, which coincided with the drop in wastewater concentrations we observed last week. COVID-19 hospitalizations dropped from around 15,100 in week 9 to about 13,400 in week 10. The national COVID-19 test positivity rate declined from 6.5% in week 9 to 5.2% in week 10. Deaths due to COVID-19 dropped by 4.8% from the previous week and currently represent 2% of all deaths in the US.
Regional
The South
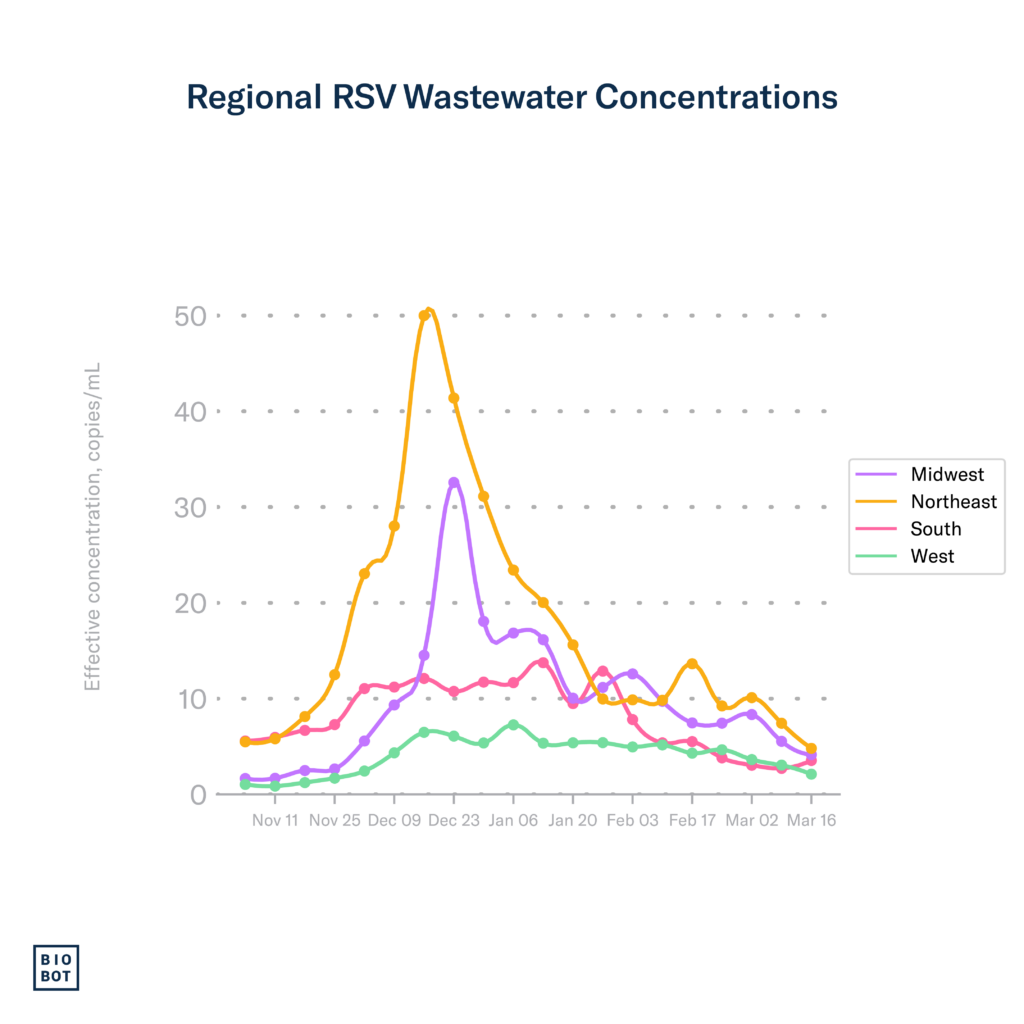
RSV: In the South, RSV wastewater concentrations increased slightly but remained low overall in week 11. RSV test positivity decreased in the South during week 10 and is currently at 1.8%. These are similar levels to what was observed in the South in August, indicating that RSV activity is currently very low.
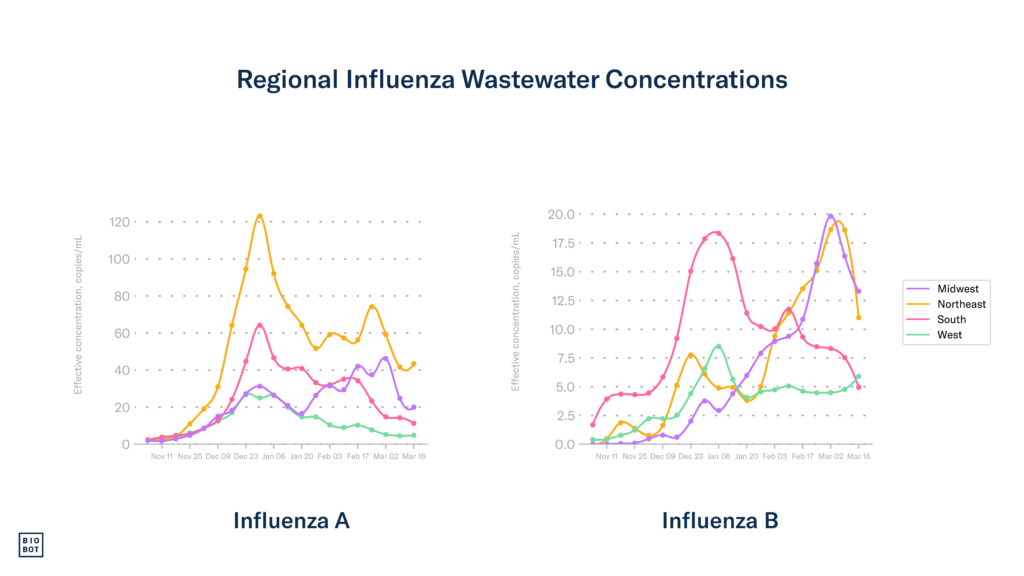
Influenza: The South experienced decreases in both influenza A and influenza B wastewater concentrations in week 11 following a brief plateau. Continuing the good news, all but one state (Oklahoma) in the South experienced a decrease in outpatient visits for influenza-like illness (ILI) during week 10. The number of states in the High ILI category decreased in week 10, with four states (Oklahoma, Arkansas, Tennessee, and Virginia) and the District of Columbia remaining in the High level. Influenza activity appears relatively low in the South and continues to decline.
COVID-19: SARS-CoV-2 wastewater concentrations slightly declined in the South during week 11, currently at 456 copies/mL. In week 10, more states reported decreases in hospitalizations due to COVID-19 compared to the previous week, with all states currently reporting decreases. These are good signs that COVID-19 activity continues to decline in the South.
The Midwest
RSV: RSV wastewater concentrations declined in the Midwest during week 11. Test positivity during week 10 also declined, currently at 3.9%. While RSV activity has lingered in the Midwest longer than in some regions, these declining trends are good signs that the Midwest is getting very close to the end of the RSV season.
Influenza: Influenza A and influenza B wastewater concentrations declined in week 11 in the Midwest. Following the decreases in influenza concentrations observed over the past two weeks, clinical data also show good signs of declining activity during week 10. All but three states (North Dakota, South Dakota, and Iowa) reported decreases in ILI outpatient visits. While these decreases are good signs that the Midwest is moving past its second wave of influenza, Iowa, Michigan, and Ohio remain at a High level for ILI activity, suggesting that influenza levels remain elevated in some parts of the region.
COVID-19: Unfortunately, SARS-CoV-2 wastewater concentrations increased in the Midwest during week 11, currently at 795 copies/mL. During week 10, most states in the Midwest experienced a decrease in COVID-19 hospitalizations, with only three (North Dakota, South Dakota, and Iowa) experiencing increases. We’ll keep an eye on the Midwest and hope that activity starts declining again quickly.
The Northeast
RSV: RSV wastewater concentrations in the Northeast continued to decline during week 11, currently at levels as low as we observed in early November. RSV test positivity also declined during week 10, currently at 1.6%. RSV activity remains quite low in the Northwest.
Influenza: The Northeast experienced a slight increase in influenza A wastewater concentrations during week 11, while influenza B concentrations declined. Clinical metrics for influenza continued to decline for most states in the Northeast, with all but two states (Connecticut and Rhode Island) showing decreases in influenza-like illness outpatient visits in week 10. We’ll be keeping an eye on influenza A in the Northeast and hope that wastewater concentrations come back down soon.
COVID-19: SARS-CoV-2 wastewater concentrations declined in the Northeast during week 11, currently at 600 copies/mL. Clinical COVID-19 metrics also continued declining during week 10, with all but two states (New Hampshire and Rhode Island) experiencing a decrease in COVID-19-associated hospitalizations.
The West
RSV: RSV wastewater concentrations continued to decline in the West during week 11 and are currently very low. Unfortunately, RSV test positivity increased in the West during week 10 at 3.7%. Wastewater data indicates that RSV activity is low, but we’ll be keeping an eye on test positivity and hope it comes back down soon.
Influenza: Wastewater concentrations for influenza A remained stable and low in the West during week 11 and are at similar levels to those observed in late November. Unfortunately, influenza B concentrations increased slightly during week 11. Most states in the West experienced a decline or no change in influenza-like illness outpatient visits during week 10. Wyoming, Idaho, and Montana, however, experienced increases in outpatient visits due to ILI. Wyoming and New Mexico are the only states that remain at a High influenza-like illness activity level. Despite fluctuations in these states, influenza activity mostly continues to decline in the West.
COVID-19: SARS-CoV-2 wastewater concentrations did not change in the West during week 11, currently at 299 copies/mL. These are the lowest concentrations observed in the West since July of 2023. During week 10, while most states in the West experienced a decrease in COVID-19 hospitalizations, four states experienced increases (Wyoming, New Mexico, Utah, and Alaska). Despite these increases, wastewater and clinical data indicate that COVID-19 activity is relatively low in the West currently.
Footnotes:
Wastewater data from Biobot Analytics for RSV, influenza, and SARS-CoV-2 are through March 16, 2024 (MMWR week 11). Clinical data on testing, hospitalizations, and emergency department visits for RSV, influenza, and COVID-19 are from the Centers for Disease Control and Prevention. Updates to clinical data for RSV, influenza, and COVID-19 are through March 9, 2024 (MMWR week 10).