Blog
Wastewater data can predict coronavirus cases

July 30, 2020


As the U.S. continues to grapple with a rise in COVID-19 cases across the country, public health officials have an incredibly difficult job determining when to reopen communities and businesses, as well as when to issue stay-at-home orders in response to new outbreaks. Now, more than ever, officials need smarter data to help them make these tough decisions.
Unfortunately, current testing and hospitalization data present a narrow and delayed snapshot into the spread of the virus within a community. This data also does not account for asymptomatic cases, which constitute a high proportion of any given infected population.
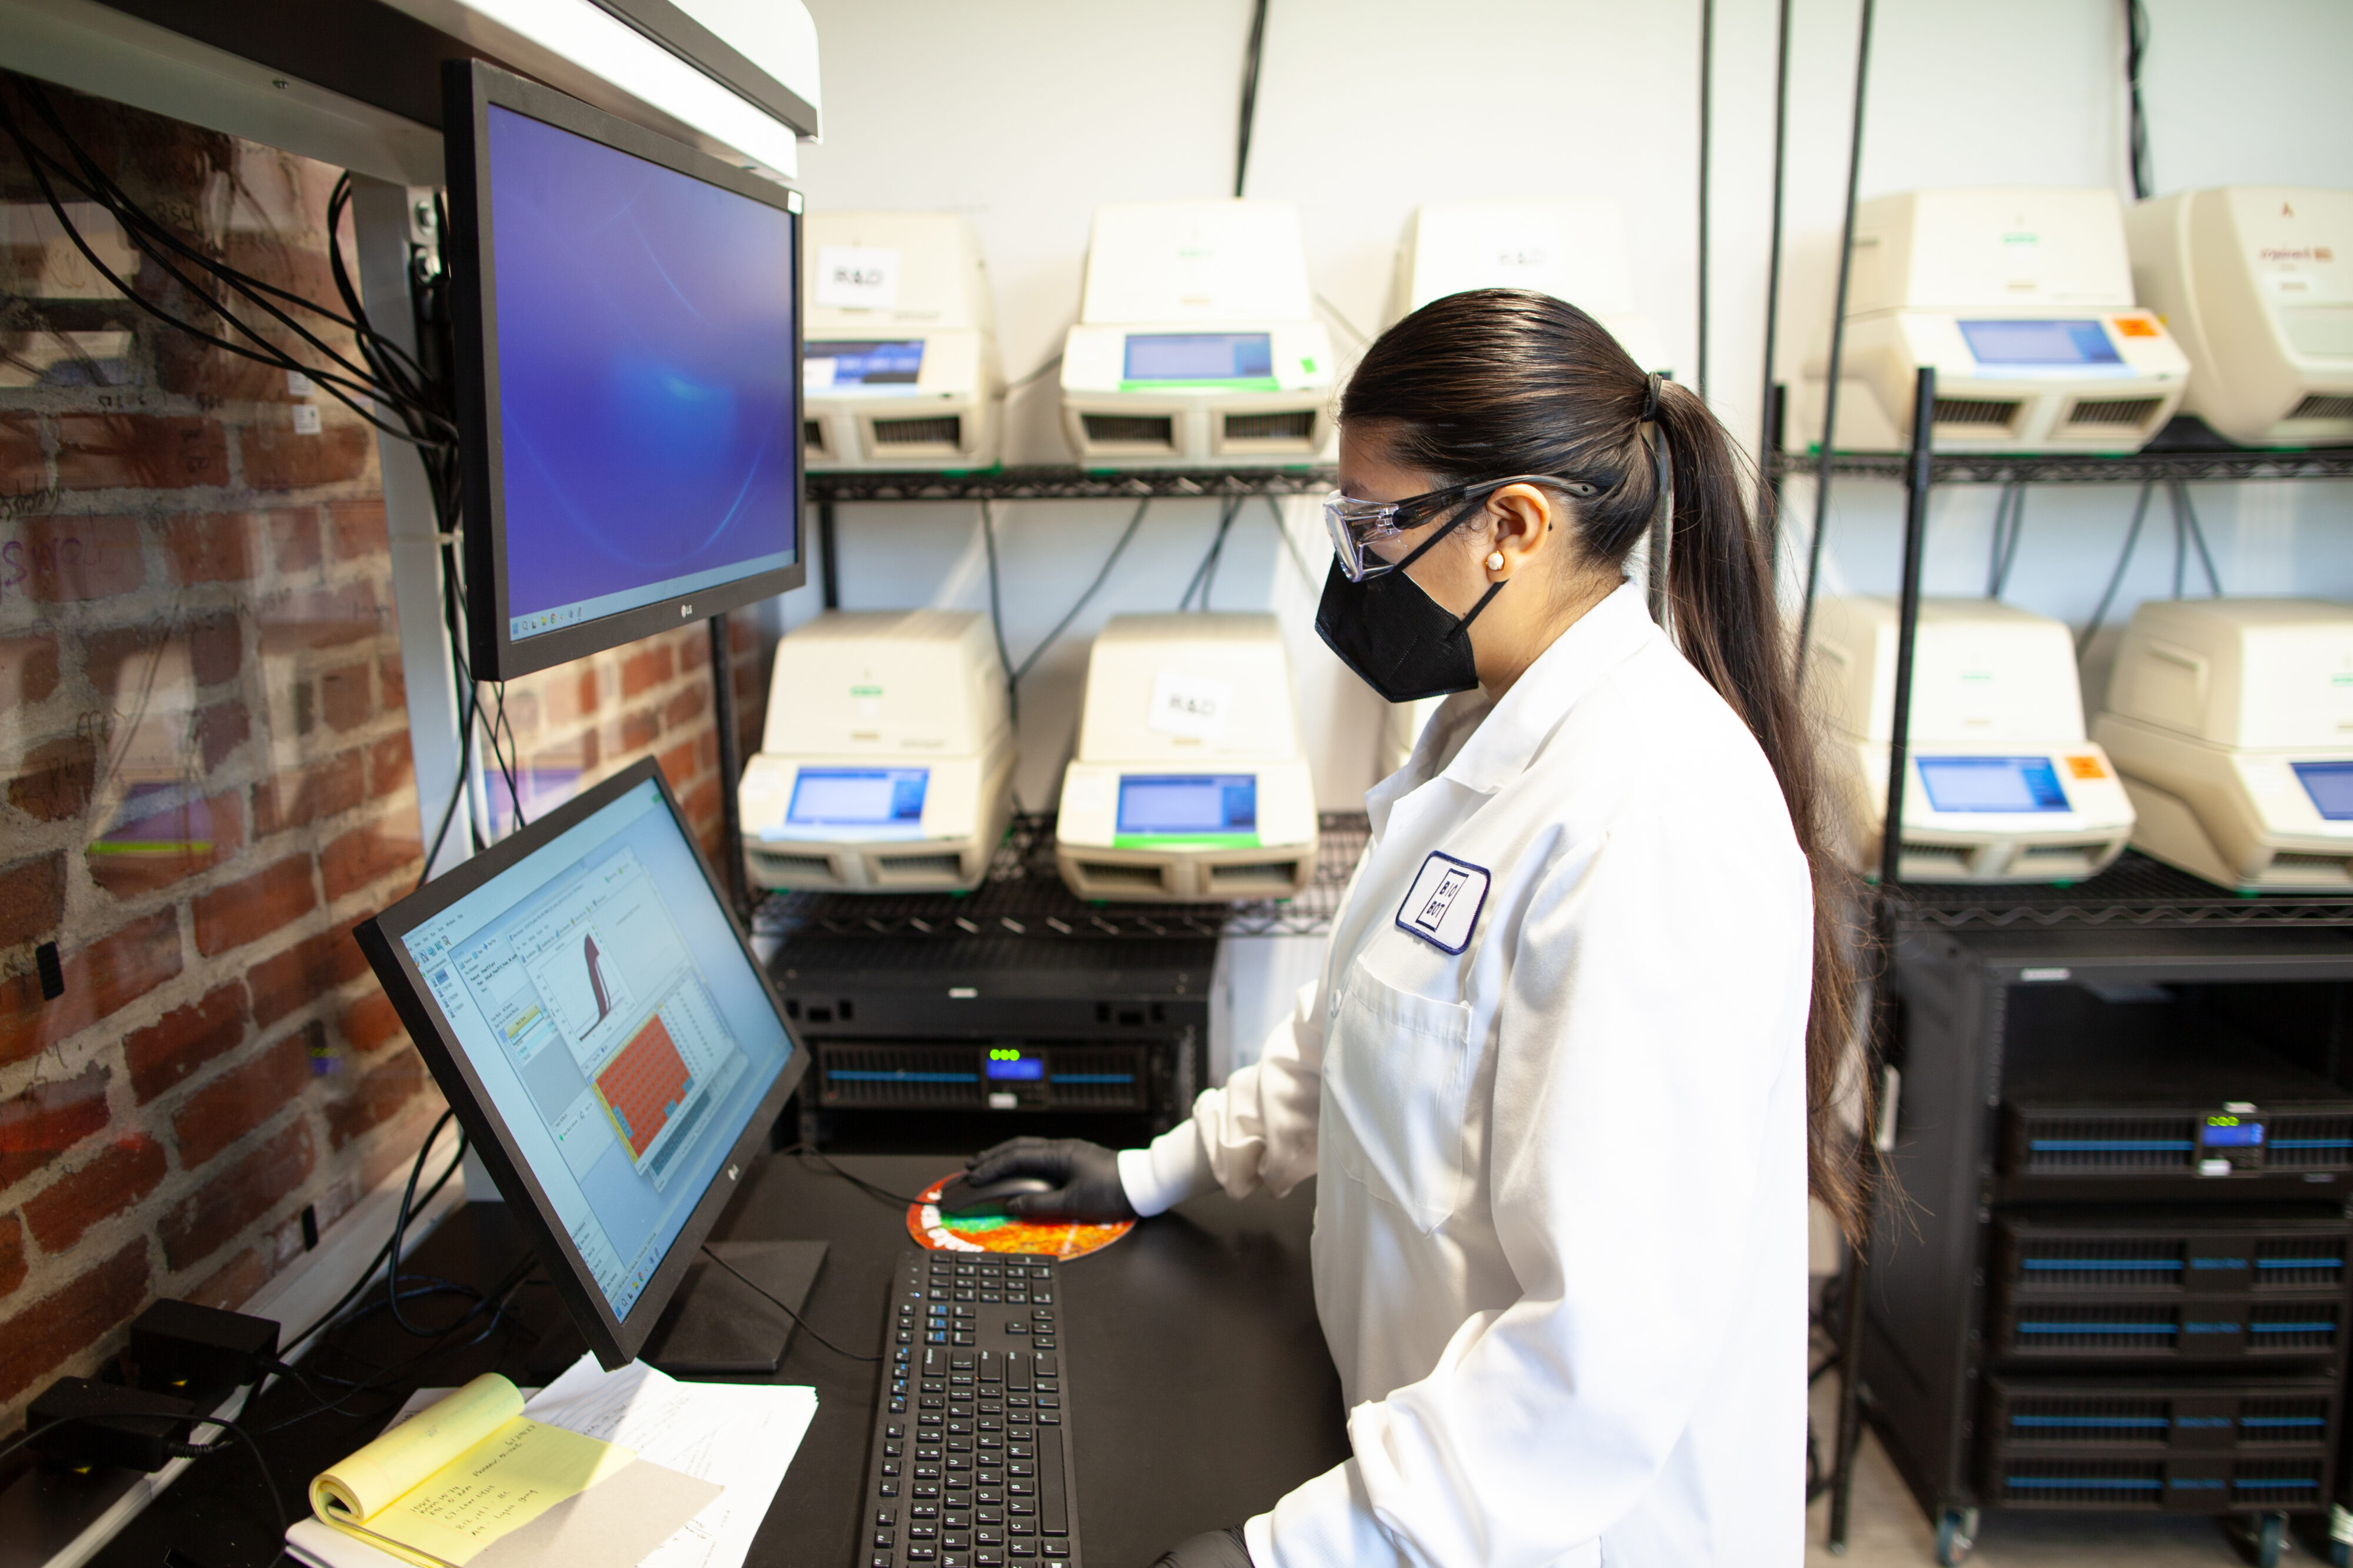
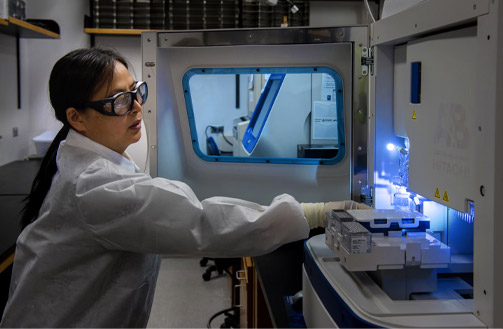
For the past several months, we at Biobot Analytics have been analyzing sewage to understand and quantify the presence of COVID-19 in communities. This is possible because infected individuals shed SARS-CoV-2 (the virus that causes COVID-19) in their stool, regardless of whether they have symptoms. Moreover, infected individuals shed most frequently immediately after contracting COVID-19 — and start shedding an average of seven days before exhibiting symptoms. Since we first successfully quantified SARS-CoV-2 in wastewater in March 2020, we have worked with hundreds of communities across the United States and Canada to map the novel coronavirus concentrations in sewage over time. To date, we have generated data representing over 10% of the U.S. population and 5% of the Canadian population.
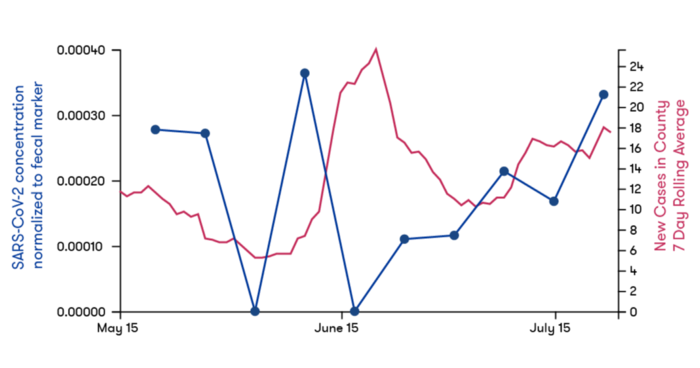
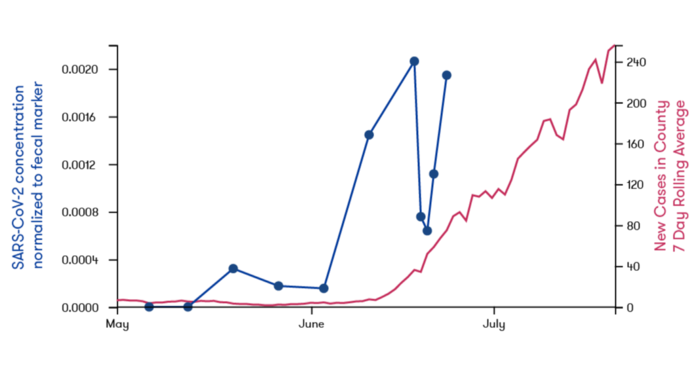
Because of the early onset of viral shedding, along with an additional delay between the presence of symptoms and clinical test results, wastewater data has been shown to be a reliable leading indicator of COVID-19 cases. In other words, wastewater provides an early warning for cases that will be diagnosed and reported in a community several days later.
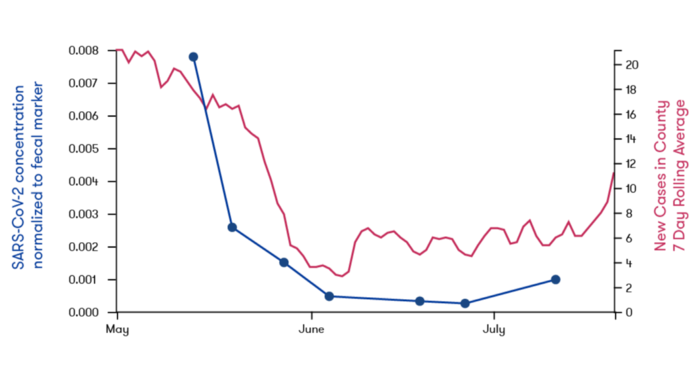
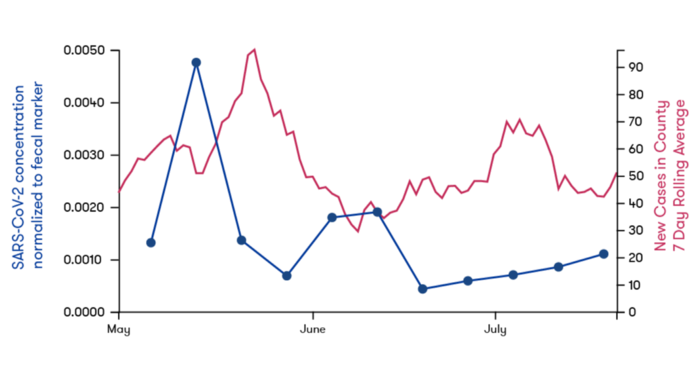
In the time series shown below, which have been drawn from wastewater analysis reports generated for the communities we work with, the virus concentration in wastewater (blue lines) increased a few days before new cases (red lines) showed a similar increasing trend in each corresponding location.

The early warning this data provides is especially useful to local policymakers as they make plans to reopen and protect against new waves of COVID-19 infections. Biobot has partnered with hundreds of communities in 42 states to better understand and anticipate the spread of COVID-19, and we are excited about the potential for Wastewater-Based Epidemiology to proactively detect future outbreaks and accelerate a safe reopening. Learn more about how it works by visiting our website.
References
Wu, F. et al. (2020) SARS-CoV-2 titers in wastewater are higher than expected from clinically confirmed cases. mSystems. https://msystems.asm.org/content/5/4/e00614-20
Wu, F. et al. (2020) SARS-CoV-2 titers in wastewater foreshadow dynamics and clinical presentation of new COVID-19 cases. medRxiv. https://www.medrxiv.org/content/10.1101/2020.06.15.20117747v2
Written by Biobot Analytics
Biobot provides wastewater epidemiology data & analysis to help governments & businesses focus on public health efforts and improve lives.