Blog
COVID-19 pandemic review: insights from wastewater intelligence over the years

January 25, 2023
Many things have changed over the past three years since SARS-CoV-2 was first recognized in China, and the first COVID-19 case was identified in the U.S. in Washington state on January 20, 2020. Public health agencies scrambled to set up new data systems in record time, and a host of scientific breakthroughs were accomplished with unparalleled speed—from the creation of vaccines and treatments, to extensive amounts of scientific research and literature.
As the pandemic has progressed, metrics to measure the burden of disease have come and gone. Case counts were once the gold standard metric, but have become less useful with the proliferation of at-home tests and closing of many public testing centers. Hospitalizations continue to be an important metric to track, both for understanding the disease itself, and for tracking healthcare system capacity, but hospitalizations are a lagging indicator of disease activity. In contrast, a metric that has come to the forefront of surveillance as a reliable indicator of infection trends has been measuring levels of SARS-CoV-2 in wastewater.
Year-over-year wastewater monitoring of SARS-CoV-2
Because measuring SARS-CoV-2 in wastewater is independent of individual testing and doesn’t require the public to adjust their behavior, it doesn’t suffer from the same challenges that a metric like case reporting does. Biobot Analytics has been conducting SARS-CoV-2 wastewater testing on collected samples since January 2020, and this extensive dataset provides rich insight into the progression of the pandemic. By aggregating data from hundreds of wastewater treatment plants across the country, Biobot is able to produce a multi-year time course of wastewater concentrations in the U.S. This national average over time is made available on our public dashboard, along with regional averages, county-level averages, and an interactive variant data visualization.
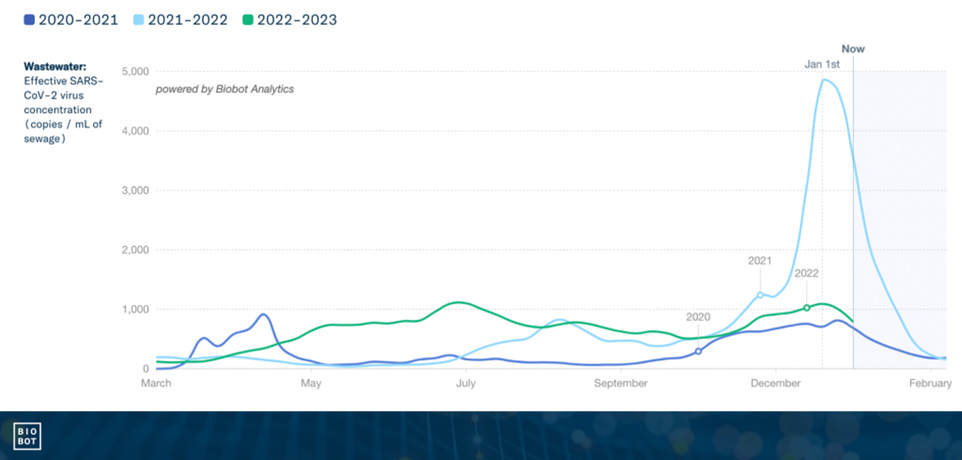
Now that Biobot has data available for multiple years, we are adding a new plot to our public dashboard that shows SARS-CoV-2 concentrations by month, with all years on the same plot. This way of visualizing the data makes it easier to relate where we are now to previous points in the pandemic. Unlike diseases such as influenza where year-over-year plots would typically show a strong seasonal pattern peaking in the winter months and consistently low levels during the summer, this view makes it clear that SARS-CoV-2 has not settled into a strong predictable seasonal pattern.
Year-over-year wastewater concentration trends in the U.S.

Despite the overall lack of consistent year-round seasonal trends, there has been a pattern observed each year of increasing SARS-CoV-2 concentrations in wastewater in the Fall/ Winter, which begin to decrease in early January. Looking at the plot, you can see the timing of this peak is nearly identical in each of the three years.
Chronicling a pandemic year-by-year through wastewater
Year one: Initial wave and the emergence of the first variant

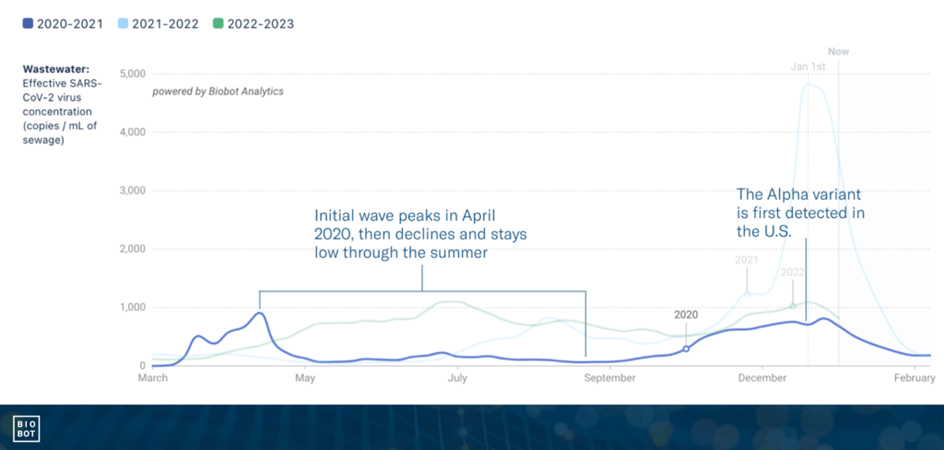
The first major peak in wastewater occurred from March to May of 2020, and was followed by a period of relatively low levels throughout the summer. This sparked hope that COVID-19 would be a seasonal illness, and that we would not see large summer waves. Winter 2020-2021 brought the first recognized variant, the B.1.1.7 variant (later named Alpha). The winter wave receded by February and SARS-CoV-2 wastewater levels decreased, though never to as low as they did during Summer 2020.
Year two: The summer Delta wave

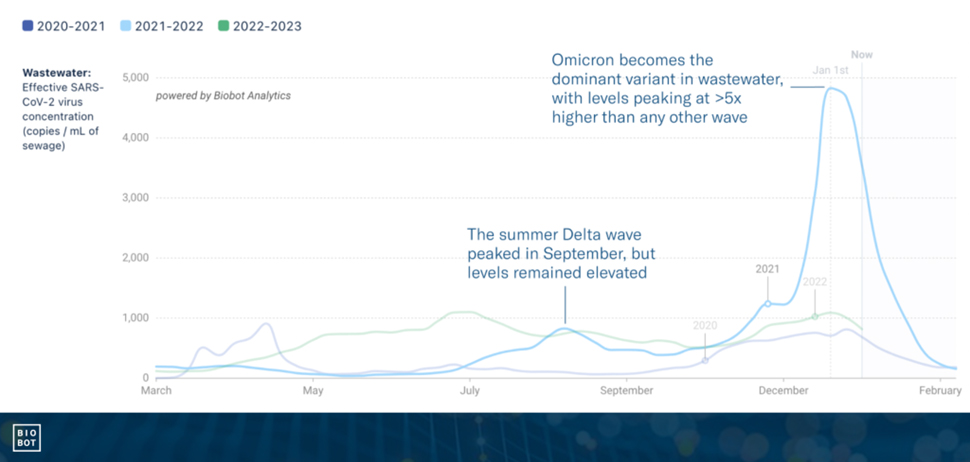
The next major peak in wastewater levels happened from July to September 2021, and was driven by B.1.617.2, better known as the Delta variant. After the peak of the Delta wave in late summer, levels only dropped slightly before starting to tick back up again. This increase was gradual at first, but once December hit and Omicron (BA.1) became the dominant variant, surveillance metrics across the board began to exponentially increase. Wastewater concentrations peaked the week of December 27, 2021 at nearly 5,000 copies/mL! For scale, the initial 2020 wave, the winter 2020-2021 wave, and the Delta wave all peaked at less than 1,000 copies/mL.
Year three: The wave that went on and on

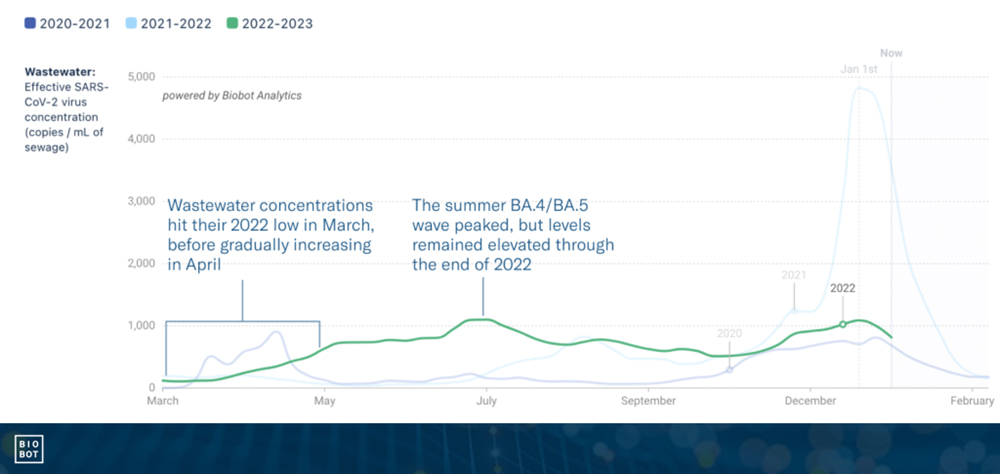
After the intensity of the Omicron wave, wastewater levels dropped back down to relatively low levels for February and March of 2022, but started to increase again slowly, and by May, national levels were at around the same levels as the peak of the Delta wave the previous summer. Remarkably, these elevated levels remained throughout the rest of 2022.
The year-over-year plot shows that 2022 never saw the drop in concentrations observed in the previous two summers. Levels started to dip in the Fall 2022, but only barely dipped below previous peaks before reversing trend and heading upward again in November. Matching trends from previous years, wastewater concentrations peaked in the last week of December before starting into 2023 on a downward trend.
Year four and beyond
As we start 2023, wastewater levels are declining, but whether 2023 will match the pattern of 2020, 2021, 2022, or forge its own unique path remains to be seen. What is certain though is the place that wastewater monitoring holds for answering this question. The Biobot team works hard not just to generate wastewater data for SARS-CoV-2, but also to provide interesting and intuitive analysis through our public communications on our website and social media platforms such as Twitter and LinkedIn. To that end, we are excited to add this new year-over-year visualization to our website, and make one more tool available to anyone interested in reliable information about SARS-CoV-2 levels and trends in the U.S. Follow along for future updates!
Written by Biobot Analytics' Epidemiology Team
Biobot provides wastewater epidemiology data & analysis to help governments & businesses focus on public health efforts and improve lives.


