
Summary: Week of 6/17/24
We continue to monitor the rapidly evolving H5N1 influenza virus situation. As we do, a quick reminder that Biobot’s influenza A assay detects the H5N1 influenza subtype, which is an influenza A virus, but does not distinguish between the different subtypes of influenza A (e.g., H5N1 vs H1N1).
Thankfully, we still have not seen large, widespread increases in influenza A concentrations. Data through week 24 (June 15) also indicate that influenza activity remains low in the four US regions. We want to highlight some important points about the role of Biobot’s wastewater data in understanding the current circulation/risk of H5N1:
- At this point, we cannot determine if any upticks we’ve observed are due to seasonal influenza A virus or if H5N1 could have played a role.
- Biobot is currently testing for influenza A in 8 out of the 12 states with positive dairy herds (Texas, New Mexico, Kansas, Idaho, Ohio, North Carolina, Iowa, and Wyoming), among several other states across the country.
- Our current assays do not distinguish between human infections and infected animals shed in the wastewater system.
This situation is rapidly evolving and our team will continue to monitor H5N1 closely. We will provide any additional information as it becomes relevant or available via Twitter and here in the risk reports.
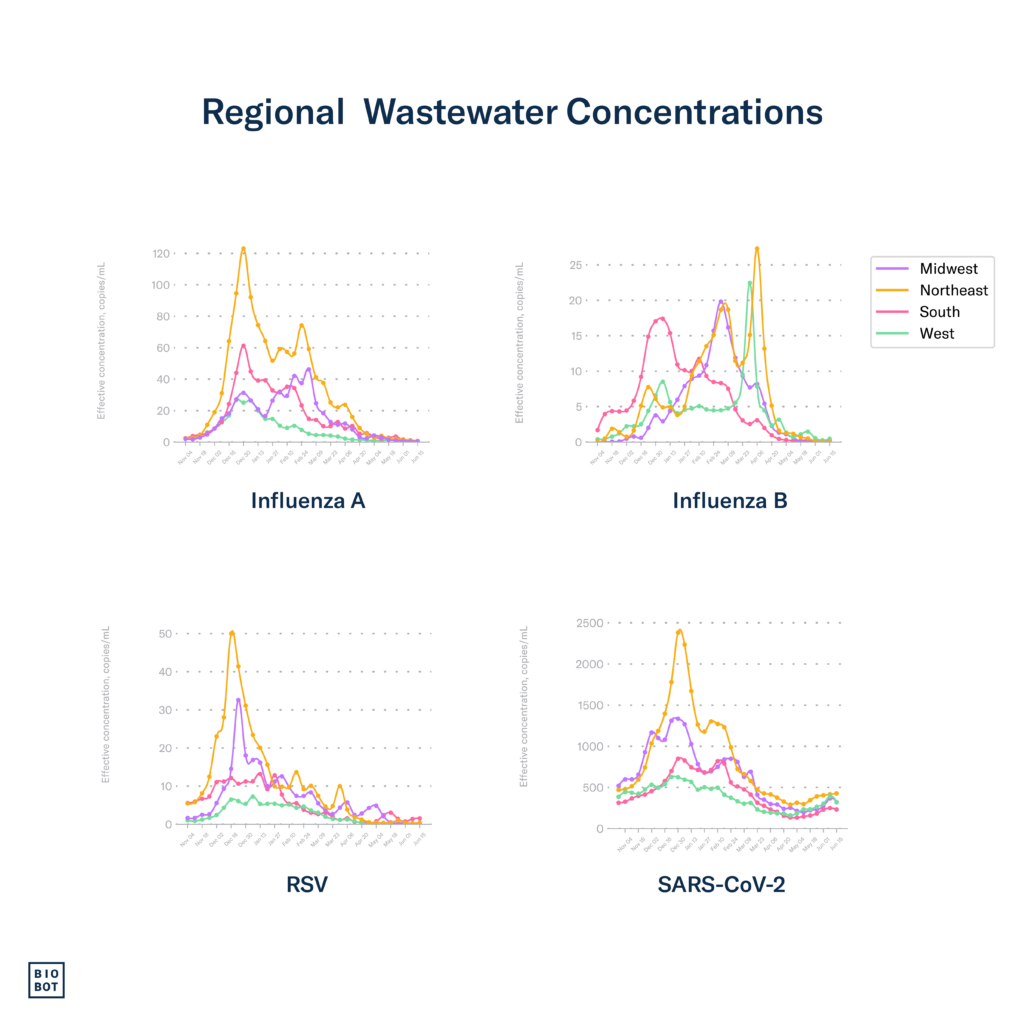
Biobot’s national wastewater network showed decreasing and very low national concentrations of influenza A & B and RSV during week 24. In great news, SARS-CoV-2 also began to decrease in week 24, although levels remain elevated. Nationally, major clinical metrics remained low for influenza and RSV in week 23, while some metrics for COVID-19 remained elevated. The percentage of outpatient visits due to influenza-like illness (ILI) remains below the national baseline of 2.9%, currently at 1.7%. All states have a minimal ILI activity level; overall, the clinical respiratory illness burden remains low.
The Bottom Line: As we head into summer, we continue to keep our eyes on two things: 1. SARS-CoV-2 concentrations, which suggest that we are in an early-summer wave, and 2. The evolving H5N1 situation, which does not currently pose a significant threat to human health. Closely monitoring both these situations is essential to protecting human health. Our recommendations to keep yourself and loved ones healthy remain the same: if you feel unwell, minimize contact with others, consider wearing a mask in crowded areas, and stay current with vaccinations and boosters.
Note: Disease burden due to influenza is currently very low across the US, and because of this, we are going to pare back the metrics that we report on during the summer low season. However, if we see something notable, we will definitely address it.National Outlook
RSV
Nationally, RSV concentrations remained very low in week 24.

Influenza
Nationally, influenza A and B concentrations continued to decline in week 24, and overall, both remained low.
Clinical data showed that the illness burden due to influenza remained quite low in week 23. The percentage of outpatient visits for influenza-like illness (ILI) – typical in flu, RSV, and COVID-19 patients – declined and remains below the national baseline of 2.9%, currently at 1.7%. FluSurv-NET reports that the influenza hospitalization rate per 100,000 persons also remains very low, currently at 0.1 in week 23. These metrics are at levels we would typically expect for this time of year and indicate low influenza activity.

COVID-19
In good news, wastewater data show that COVID-19 activity and community viral load slightly declined during week 24. The national average SARS-CoV-2 wastewater concentration is now 330 copies per mL.
Clinical metrics continued to show signs of increasing COVID-19 activity in week 23, but there are hints that these increases could be slowing down. Test positivity increased, currently at 5.4%. COVID-NET reports that the COVID-19 hospitalization rate held steady, currently at 1 per 100,000 persons in week 23. Deaths due to COVID-19 held steady and currently represent 0.6% of all deaths in the US.

Regional
The South
RSV: In the South, RSV wastewater concentrations remained stable and very low during week 24.
Influenza: Influenza A and B concentrations held steady at very low levels in the South during week 24. Clinical data continues to confirm that the disease burden due to influenza remains low—all Southern states remained at a minimal ILI activity level through week 23.
COVID-19: SARS-CoV-2 wastewater concentrations slightly declined in the South during week 24, currently at 232 copies per mL. The two Southern states in COVID-NET, an enhanced hospitalization surveillance system, are Georgia and Tennessee. Georgia experienced a slight decrease in COVID-19 hospitalization rates in week 23, while Tennessee appears to be experiencing a slight increase. Overall, COVID-19 hospitalization rates in both states remained low.
The Midwest
RSV: RSV concentrations remained stable and very low in the Midwest during week 24.
Influenza: Influenza A and B wastewater concentrations remained stable and very low in the Midwest in week 24. Clinical data continues to show a low influenza illness burden in the Midwest – all states remained at the Minimum ILI activity level in week 23.
COVID-19: SARS-CoV-2 wastewater concentrations declined in the Midwest during week 24, currently at 321 copies per mL. Michigan, Minnesota, and Ohio are Midwestern states in COVID-NET. In week 23, hospitalization rates were very low in all three, and they appeared to either decrease or hold steady.
The Northeast
RSV: In the Northeast, RSV wastewater concentrations remained stable and very low during week 24.
Influenza: During week 24, Influenza A and B concentrations held steady and remained very low in the Northeast. In week 23, all Northeastern states remained at the minimal ILI activity level.
COVID-19: SARS-CoV-2 wastewater concentrations held steady in the Northeast during week 24, currently at 426 copies per mL. Connecticut, Maryland, and New York are Northeastern states in COVID-NET. In week 23, hospitalization rates were very low in all three and appeared to be either decreasing or holding steady.
The West
RSV: RSV wastewater concentrations remained stable and very low in the West during week 24.
Influenza: Influenza A and B concentrations held steady and remained very low in the West during week 24. During week 23, all Western states were at the Minimum ILI activity level, including California, which had a low activity level during week 22.
COVID-19: During week 24, SARS-CoV-2 wastewater concentrations significantly declined in the West, currently at 320 copies per mL. California, Colorado, New Mexico, Oregon, and Utah are Western states in COVID-NET. In great news, hospitalization rates decreased in California and Colorado in week 23 after both experienced increases recently. New Mexico and Colorado also continued to experience decreases. Unfortunately, hospitalization rates appear to be increasing in Utah. Despite these fluctuations, COVID-19 hospitalization rates in the West remain low overall.


Footnotes:
Wastewater data from Biobot Analytics for RSV, influenza, and SARS-CoV-2 are through June 15, 2024 (MMWR week 24). Clinical data on testing, hospitalizations, and emergency department visits for RSV, influenza, and COVID-19 are from the Centers for Disease Control and Prevention. Updates to clinical data for RSV, influenza, and COVID-19 are through June 8, 2024 (MMWR week 23).