
Summary: Week of 12/11/23
Respiratory infection activity remains high in the US. Using Biobot’s national network of sample providers, wastewater data shows active co-circulation of RSV, influenza, and SARS-CoV-2. Clinical and wastewater data shows that RSV transmission continues to be high and that we could be at or near the seasonal peak. Influenza transmission continues to rise throughout all regions of the US, primarily driven by influenza A. While influenza B is also circulating, its prevalence is notably lower compared to influenza A. Wastewater and clinical data show that COVID-19 is also continuing to rise, especially in the Midwest and Northeast, and most of the country is experiencing increases in hospitalizations and emergency department visits.
The Bottom Line: The respiratory season continues to intensify, with all three major respiratory infections currently at elevated levels. It is still a good time to think about taking steps, like staying home if you are sick or getting vaccinated, to keep yourself and your loved ones healthy.
RSV
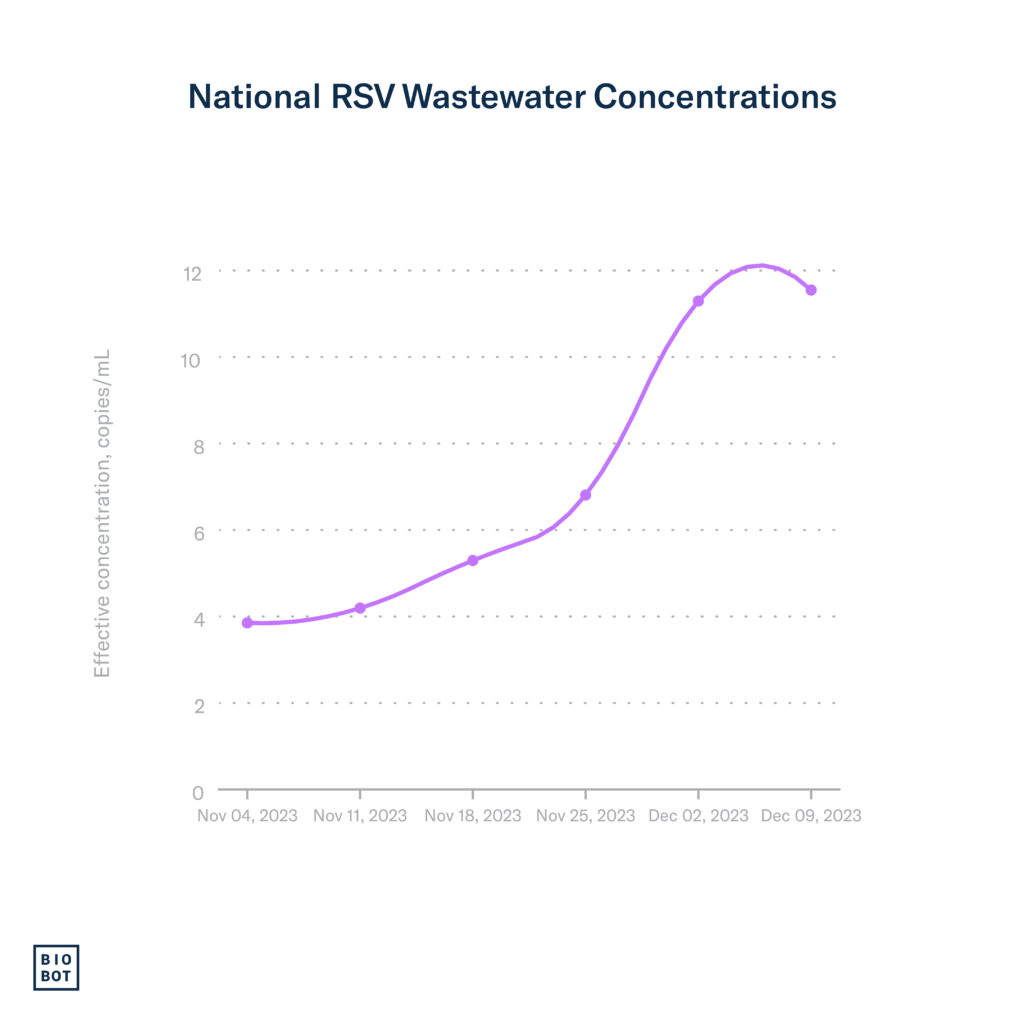
RSV transmission is currently high and may be at or near its seasonal peak.
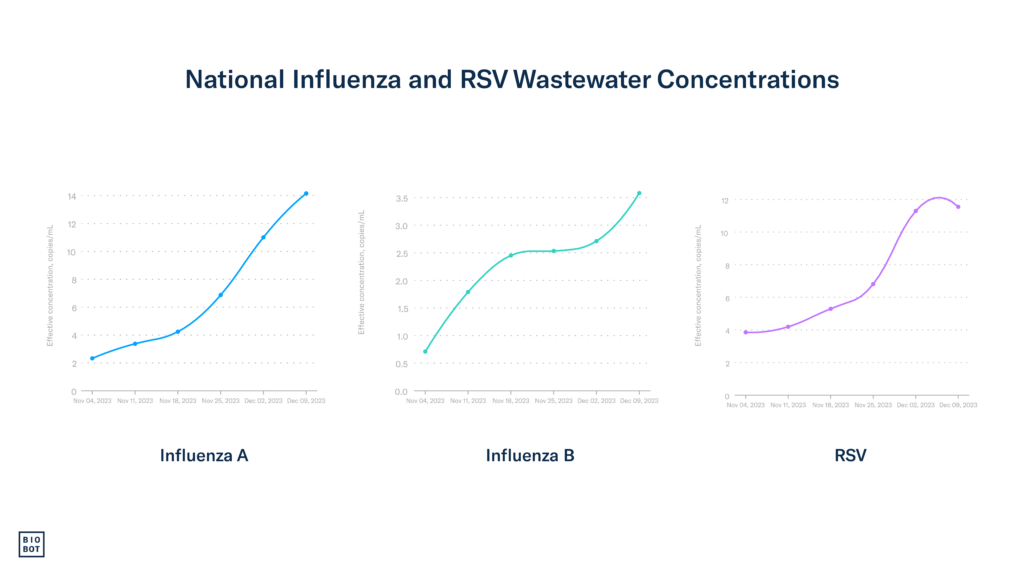
Wastewater data: Data through December 9th (MMWR week 49) show that this is the first week that RSV concentrations have remained stable, having increased by only 8%. This suggests that we are at or near the seasonal peak for RSV.
While RSV wastewater concentrations in the Northeast remained stable last week relative to the previous week, they are currently the highest in the country, followed by the Midwest. The Midwest and West experienced increases in RSV wastewater concentrations, while concentrations in the South remain stable compared to last week.
Clinical data: Data through December 2nd (MMWR week 48) show that RSV prevalence is high and may be at or near the peak, both in terms of the number and percentage of positive tests for RSV. The current national positive PCR detection percentage is 11.7%, compared to 12.8% last week. The slight decrease in test positivity could be a positive sign that we may see decreases in activity soon. This also means that RSV activity is still very high. Hospitalization rates for young children under 4 years old and for individuals aged 65 years and older remained stable and high for the previous two weeks. The percentage of hospital visits for flu-like symptoms – common among flu, RSV, and COVID-19 patients – is stable and currently at 4%, compared to 3.9% the previous week.
Southern and Northeastern parts of the US continue to have the highest RSV activity, evident in clinical and wastewater data. Indicators suggest that RSV activity in both regions is approaching or at the peak. The percentage of positive PCR tests for RSV in the south is 18.3%, a decrease from 20.9% last week but still higher than the national average of 11.7%. In the Northeast region, 12% of PCR tests for RSV are positive, down from 13.8% in the previous week. The Midwest experienced a slight increase in the percentage of positive tests, and the West remained stable.
Influenza
Influenza activity continues to increase, as indicated by wastewater and clinical data.
Wastewater data: Since we began testing for influenza types A and B in October, wastewater concentrations have continued to increase steadily. Data up through December 9th show considerable increases in influenza activity: wastewater concentrations of influenza A increased by 25%, while influenza B concentrations have seen a 21% increase. This uptick is evident across the US, with the Northeast experiencing the highest concentrations. The Midwest and Northeast experienced slight upticks in influenza B concentrations, while the South and West remained stable.

Clinical data:
Nationally, the percentage of positive tests for influenza is still increasing – currently standing at 6.8%, up from 6.2% the previous week. Weekly flu-related hospital admissions also continue to rise, with 5,753 hospitalizations for influenza in the week ending December 2nd. The percentage of hospital visits for flu-like symptoms, a commonality among flu, RSV, and COVID-19 patients, has been stable at 4.0% compared to 3.9% the previous week.
In the West and Southeast, several states are now showing elevated levels of influenza-like illness, indicating a rise in influenza activity across the US. Meanwhile, the South continues to experience the highest burden of hospitalizations.
Most of the positive flu tests continue to be positive for influenza A, which tracks what we’re finding in wastewater samples. This suggests that influenza A is being transmitted more than influenza B.
COVID-19
COVID-19 activity and community viral load are increasing – currently, the hospitalization and death rates are higher for COVID-19 than for flu or RSV.
Wastewater data: Wastewater concentrations for SARS-CoV-2, our earliest indicator for understanding COVID-19 trends, have been increasing across the country over the past seven weeks. As of December 9th, the national average is 777 copies/mL, which is 6.9% greater than it was last week (727 copies/mL). The national average concentration has remained lower than it was this time last year (~956 copies/mL). Wastewater concentrations are currently highest in the Midwest at 1,186 copies/mL and in the Northeast at 1,134 copies/mL. The Midwest didn’t experience as sharp of an increase in concentrations this past week, hinting at a potential slowdown in the region’s activity. However, it is too early to tell if they are experiencing a definitive shift in COVID-19 activity.
Clinical data: As of December 2nd, the most recent week with available COVID-19 clinical data from CDC, the percentage of COVID-19 tests that are positive has increased to 11.5% nationwide, compared to 10% in our last report. Percent positivity remains highest and is currently increasing in the Midwest (HHS region 7), at about 16.7%, up from 16.2%. Hospitalization rates for COVID-19 have increased by 17.6% in the week ending December 2nd, resulting in 22,513 hospitalizations nationally.
While death data displayed by CDC are still provisional, it is concerning to note a 25% increase in COVID-19 deaths in the previous week. As of December 2nd, 3% of deaths in the US were due to COVID-19.
As we anticipated, the most recent CDC data show that the percentage of positive tests, hospitalizations, and deaths have consistently increased over the past couple of weeks. These metrics are still climbing, suggesting that the peak is still in front of us.
Footnotes:
Wastewater data for RSV, influenza, and SARS-CoV-2 are from Biobot Analytics and are through December 9, 2023 (MMWR week 49). Clinical data on testing, hospitalizations, and emergency department visits for RSV, influenza, and COVID-19 are from the Centers for Disease Control and Prevention. Updates to clinical data for RSV, influenza, and COVID-19 are through December 2nd, 2023 (MMWR week 48).