
Summary: Week of 12/18/23
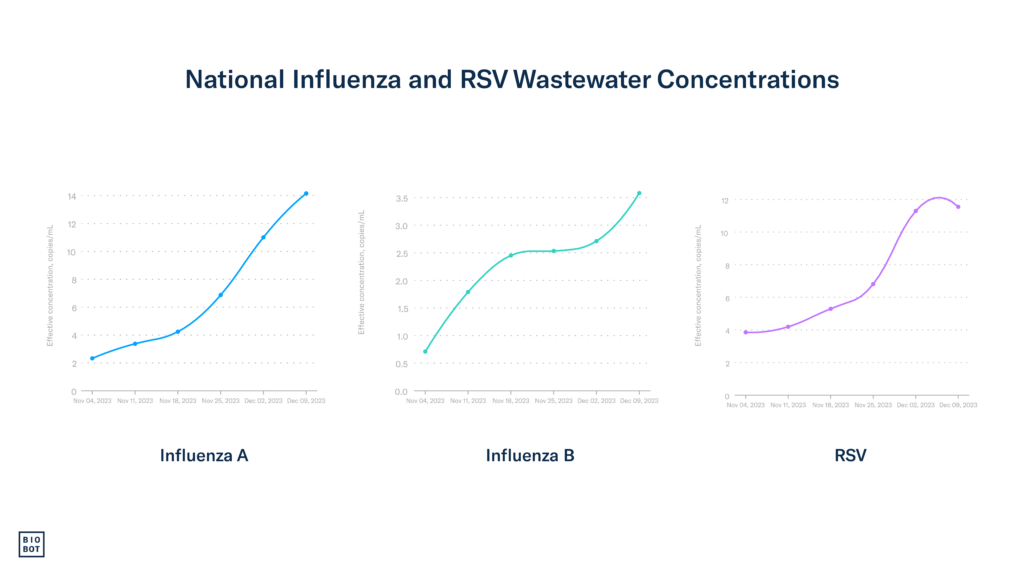
Nationally, we are in the thick of the respiratory illness season with elevated levels of RSV, influenza, and COVID-19 activity. Using Biobot’s national network of sample providers, wastewater data shows high concentrations of RSV, influenza virus, and SARS-CoV-2. Clinical and wastewater data shows that RSV transmission is remaining high, indicating that we have not yet passed the seasonal peak. Influenza A transmission appears to be taking off, having had a sharper increase this week compared to last week’s data. While influenza B is also circulating, its prevalence has remained low. Wastewater and clinical data show that COVID-19 is also continuing to rise, especially in the Northeast, and most of the country is experiencing increases in hospitalizations.
The Bottom Line: As the respiratory season intensifies, the prevalence of the three primary respiratory infections remains high. It’s a great time to think about ways to keep yourself and your loved ones safe and healthy. Consider staying home if you’re feeling unwell and getting vaccinated. These simple steps can make a big difference in protecting your health and the health of those around you.
RSV
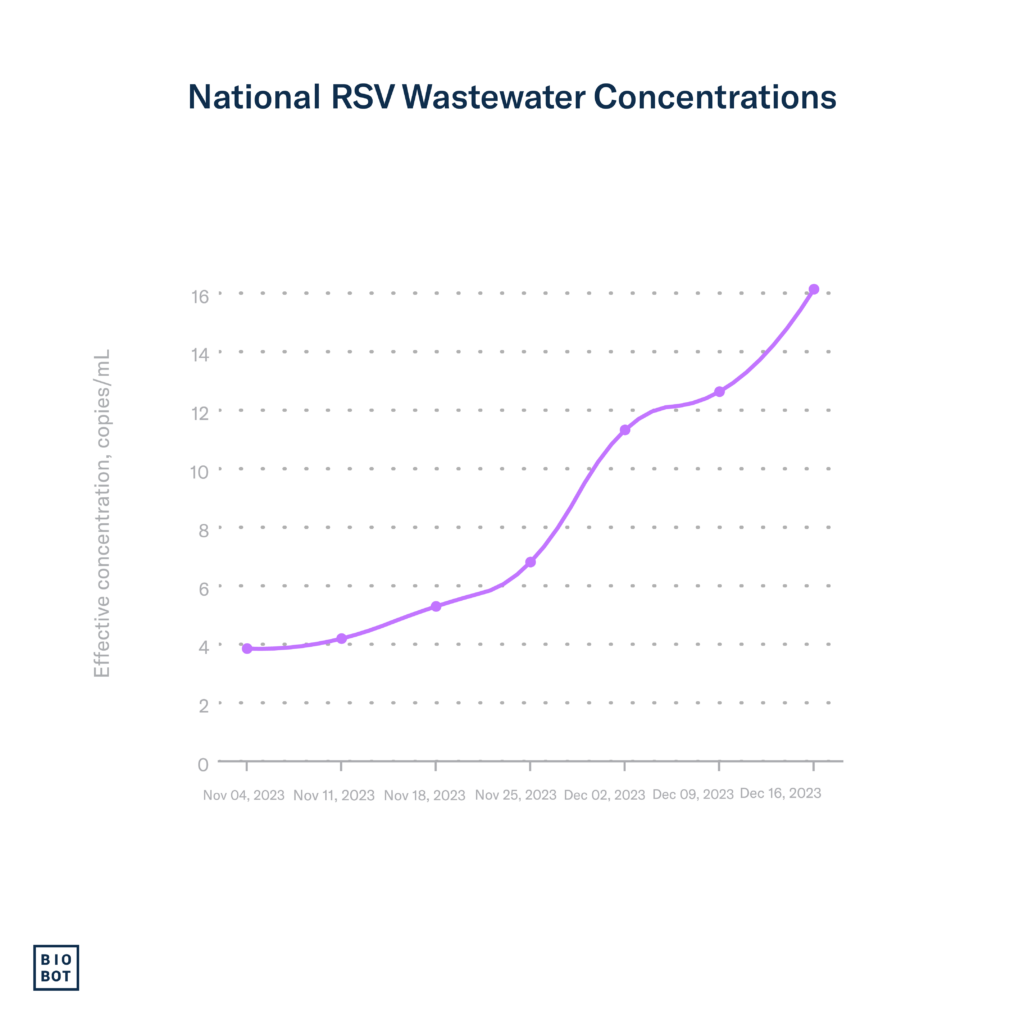
Nationally, RSV transmission is currently still high but there are signs it’s beginning to slow in the South.
Wastewater data: As of December 16th (MMWR week 50), national wastewater data indicates a 19% increase in RSV concentrations, a contrast to the previous week’s data which suggested a leveling off. This rise suggests that we have not yet surpassed the seasonal RSV peak.
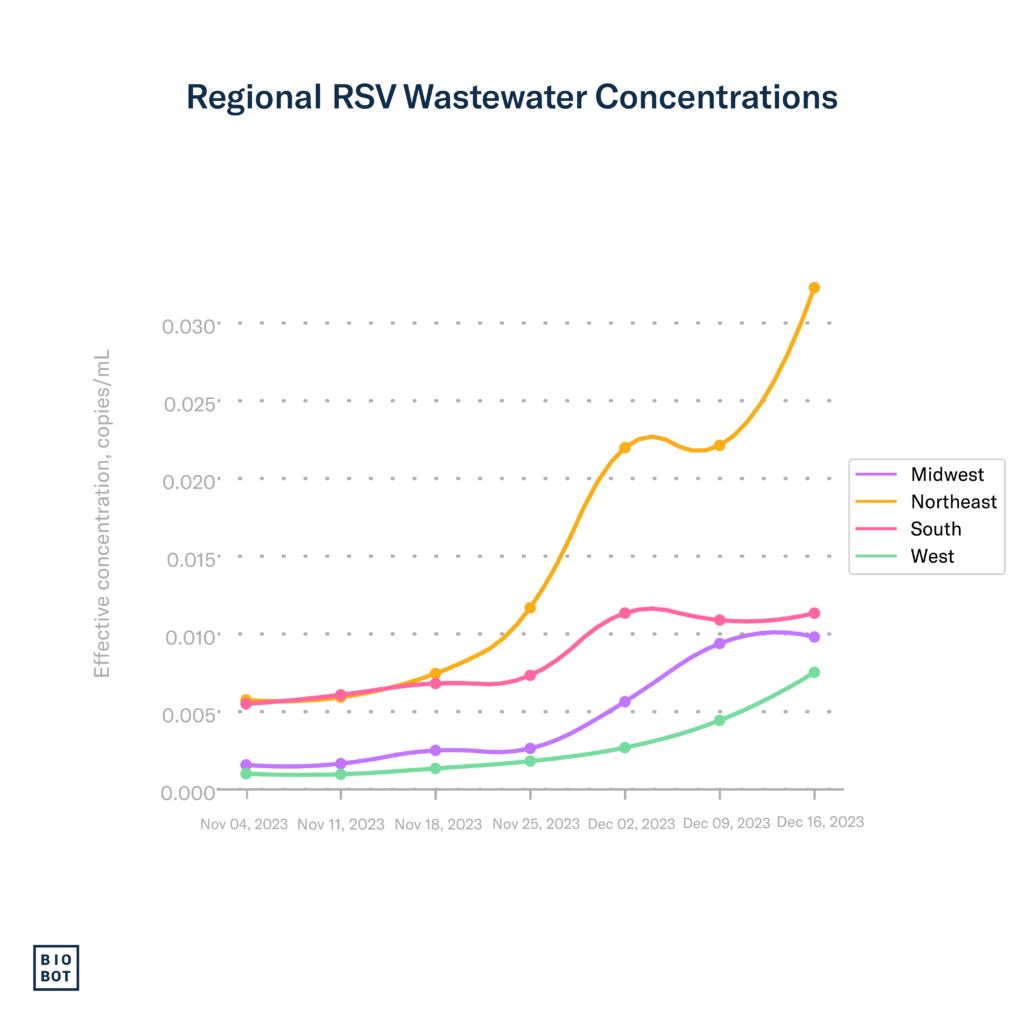
Last week, RSV wastewater concentrations in the Northeast saw a sharp increase, currently ranking as highest in the country. Meanwhile, in the West, there was a slight increase in RSV concentrations. In contrast, the South and Midwest are showing signs of stabilization, with wastewater concentrations appearing to plateau.
Clinical data: Last week’s clinical data indicated a minor decline in test positivity, but the latest figures available through December 9th (MMWR week 49) show a marginal rise, suggesting that we haven’t surpassed the seasonal peak yet. The national positive PCR detection percentage has increased to 12.3% from last week’s 11.7%. In good news, RSV hospitalization rates for children under 4 and individuals 65 years and older decreased slightly in the previous week. However, the percentage of hospital visits for flu-like symptoms – typical in flu, RSV, and COVID-19 patients – has risen to 4.4% from 4% the previous week.
In the South, while the test positivity rate of 15% is still above the national average, it has declined over the past two weeks, suggesting that RSV activity may have peaked. The Northeast and West have maintained consistent test positivity for three weeks, currently at 13.1% and 10.1% respectively. The Midwest has shown the most significant increase, now at 12.8%.
Influenza
Influenza activity continues to increase, as indicated by wastewater and clinical data.
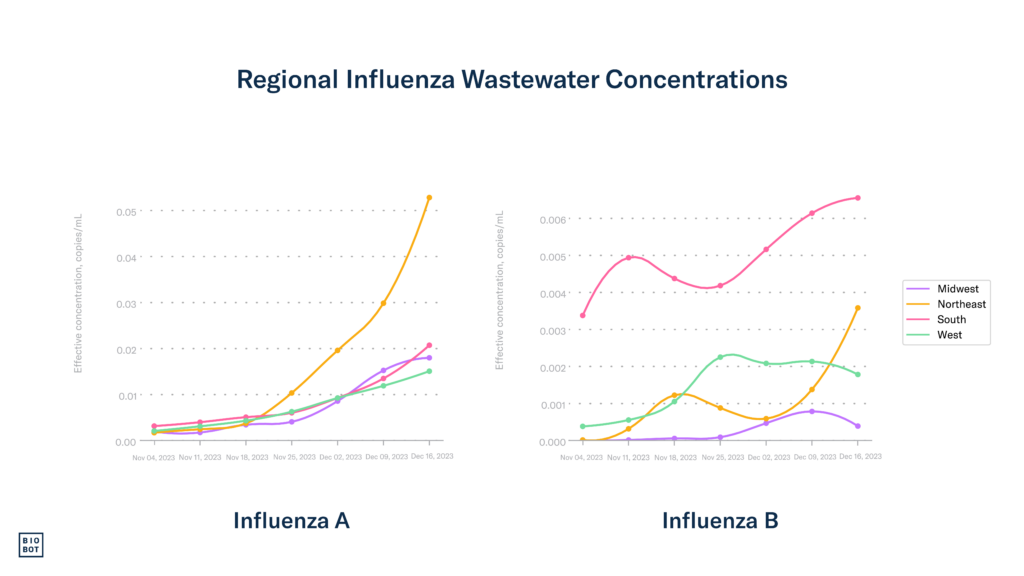
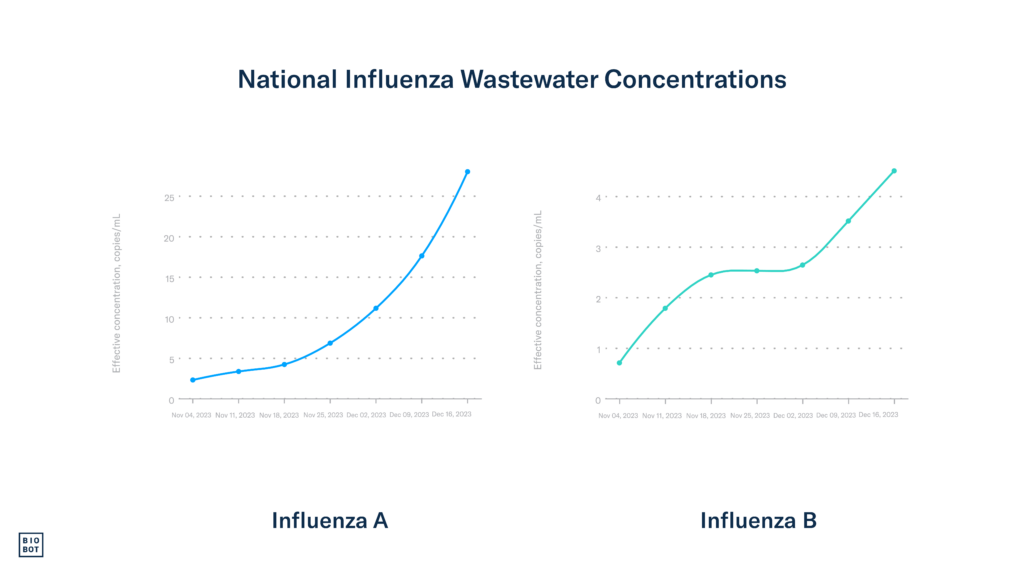
Wastewater data: Data as of December 16th show significant increases in influenza activity with a 42% increase in influenza A concentrations and 23% increase for influenza B. Increases in influenza A concentrations were experienced across the country last week, with the Northeast showing the most significant growth, continuing last week’s trend. Currently, influenza B wastewater concentrations are highest in the South, which mirrors clinical influenza sequencing data.
Clinical data: Nationally, there has been a significant rise in influenza test positivity, jumping from 6.8% in MMWR week 48 to 10.2% in week 49, ending December 9th. The most recent data also showed a notable increase in flu-related hospital admissions, with 7,090 hospitalizations. The percentage of hospital visits for flu-like symptoms, common in flu, RSV, and COVID-19 patients, climbed to 4.4% from 4.0%.
The South remains the most impacted by influenza-like-illness hospitalizations. Elevated levels of influenza-like-illness are observed in several states in the West and Southwest reflecting an upward trend in influenza activity. Meanwhile, the Midwest and Northeast still have low to moderate influenza-like-illness hospitalizations.
The majority of positive flu tests are influenza A, which mirrors what we see in wastewater. This indicates that the prevalence of influenza A is much higher than influenza B, which is the typical pattern we see most US influenza seasons.
COVID-19
COVID-19 activity and community viral load are increasing – currently, the hospitalization and death rates are higher for COVID-19 than for flu or RSV.
Wastewater data: Wastewater concentrations for SARS-CoV-2, our earliest indicator for understanding COVID-19 trends, have been increasing across the country over the past seven weeks. As of December 16th (week 50), the national average is 859 copies/mL, which is 10% greater than it was last week (778 copies/mL). The national average concentration has remained lower than it was this time last year (~996 copies/mL). The Northeast has the highest wastewater concentrations at 1,339 copies/mL, marking a significant increase last week. Given that Biobot’s wastewater data typically precedes CDC’s clinical data by a week, this increase in the Northeast could signal upcoming increases in test positivity and hospitalizations. As hypothesized in last week’s report, it appears that the Midwest did indeed experience a slowdown in COVID-19 activity in the past week, currently at 1,025 copies/mL, however, it is too early to tell if this will be a sustained downturn.
Clinical data: As of December 9th (week 49), the national COVID-19 tests positivity rate has remained stable at around 11%, slightly down from 11.5% in the previous report. However, the Midwest (HHS region 7) shows an increase in positivity, now at 17.2%, up from 16.7%. Test positivity is lowest in the South and West, which mirrors what we see with low wastewater concentrations in these regions as well.
In week 49, COVID-19 hospitalizations rose by 3.1%, totaling 23,432 admissions nationwide. Meanwhile, the proportion of deaths attributed to COVID-19 remains unchanged at 2.9%.
With hospitalizations and wastewater concentrations still increasing, it appears that the seasonal COVID-19 peak is still ahead of us.
Footnotes:
Wastewater data for RSV, influenza, and SARS-CoV-2 are from Biobot Analytics and are through December 16, 2023 (MMWR week 50). Clinical data on testing, hospitalizations, and emergency department visits for RSV, influenza, and COVID-19 are from the Centers for Disease Control and Prevention. Updates to clinical data for RSV, influenza, and COVID-19 are through December 9th, 2023 (MMWR week 49).