

Summary: Week of 12/25/23
Nationally, influenza and COVID-19 activity continue to grow, with RSV showing some signs of slowing down. Biobot’s national network of wastewater data sample providers shows high concentrations of RSV, influenza virus, and SARS-CoV-2. These wastewater data agree with clinical data; both data sources show that RSV activity is starting to slow, which indicates that we are close to or at the seasonal RSV peak. Influenza A transmission appears to be intensifying; for the second consecutive week, its rate of increase grew substantially. Although influenza B is also circulating, its prevalence has remained low in both wastewater and clinical specimens. Wastewater and clinical data show that COVID-19 continues to rise, especially in the Northeast and Midwest, and most of the country experienced increased hospitalizations.
The Bottom Line: The three major respiratory illnesses (COVID-19, influenza, and RSV), are currently circulating at very high levels, and holiday gathering will likely further compound their transmission. To stay healthy and feeling good heading into the new year, now is a great time to take some simple steps to keep yourself and your loved ones illness-free. Consider things like staying home if you feel unwell, covering your mouth with a tissue if you cough or sneeze, and getting vaccinated.
RSV
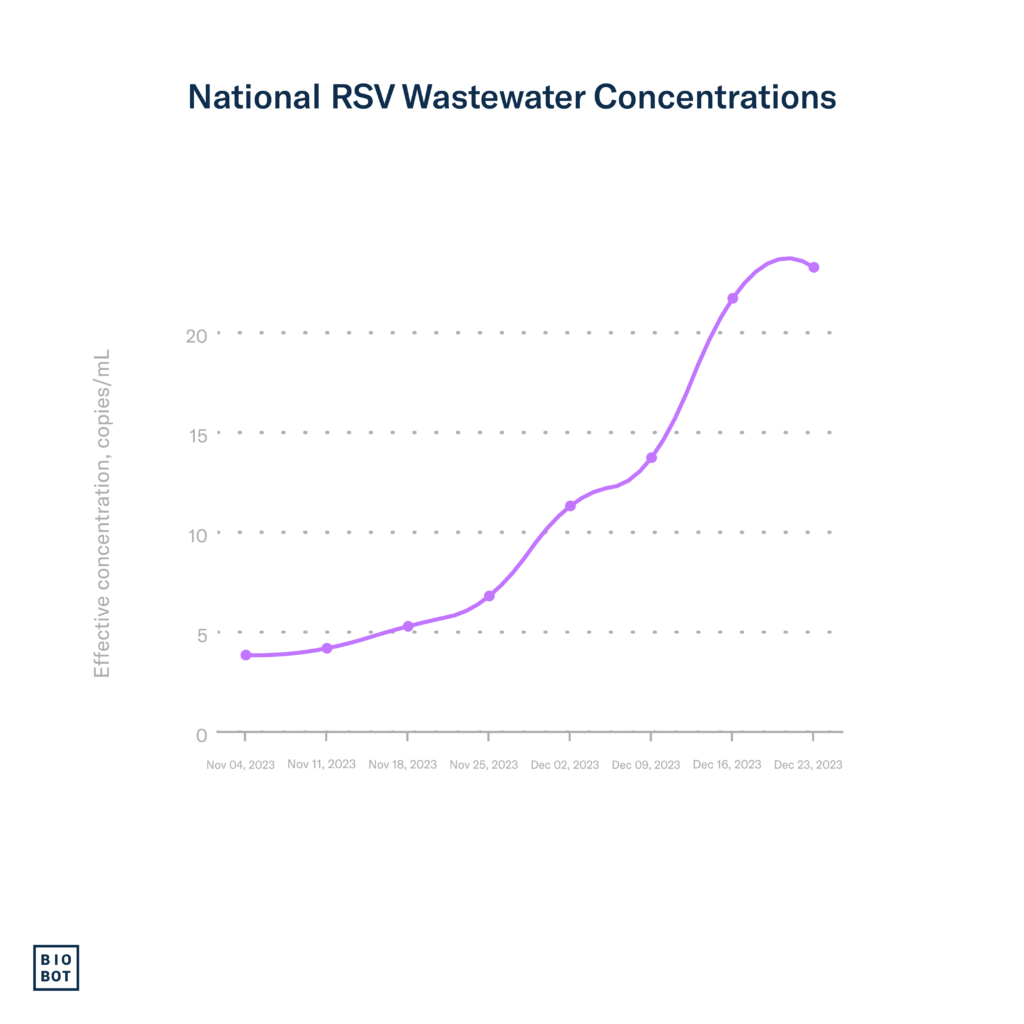
Nationally, increases in RSV wastewater concentration slowed down last week, but remain high overall. Some parts of the country experienced increases in RSV activity and others experienced slight declines, suggesting we may be nearing the peak of RSV transmission.
Wastewater data: As of December 23rd (MMWR week 51), national wastewater data indicates a 11% rise in RSV concentrations, a slowdown compared to the previous week’s growth rate. We are closely monitoring this trend to determine if the slowdown continues into next week, as it could indicate a welcome decrease in RSV activity.
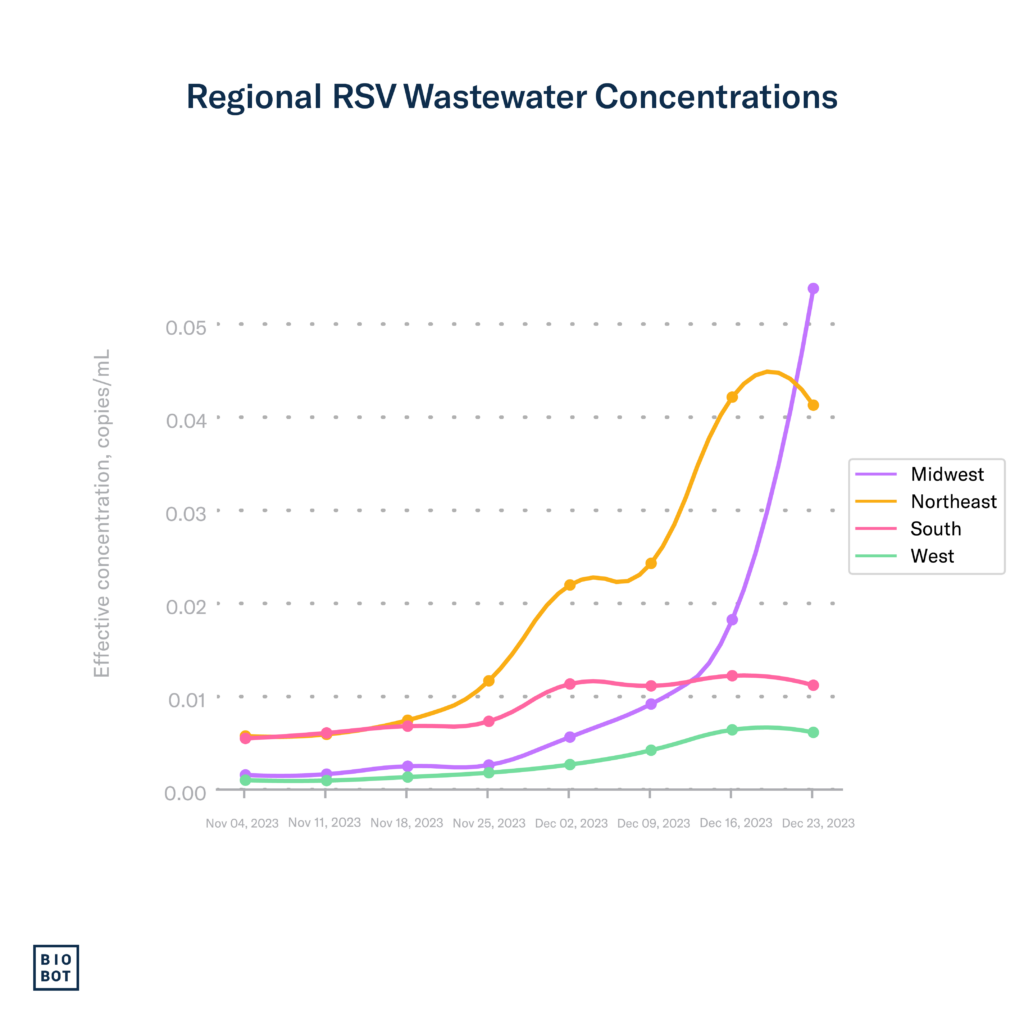
In week 50, Biobot’s wastewater data indicated that the Northeast experienced a sharp increase in RSV wastewater concentrations. In good news, data through week 51 (December 23rd) shows that RSV concentrations went down slightly in the Northeast, which was also reflected in clinical data. These are good signs that the region may be turning toward a period of less RSV activity. Wastewater concentrations also slightly declined in the South and West. Meanwhile, the Midwest experienced a sharp increase in RSV wastewater concentrations, which aligned with an increase in the percentage of PCR tests that are positive (test positivity). We’ll keep a close eye on these trends.
Clinical data: As of December 16th (MMWR week 50), test positivity for RSV decreased slightly, going down from 12.1% the previous week to 11.9% currently. RSV hospitalization rates continued to decline slightly for children under 4 and individuals 65 years and older. However, the percentage of hospital visits for flu-like symptoms – typical in flu, RSV, and COVID-19 patients – increased from 4.4% to 5.1% currently. These minimal changes suggest that we still haven’t made it through the seasonal peak nationally, and that RSV activity remains very high.
Regionally, RSV test positivity increased the most in the Midwest, growing to from 12.2% to 14%, while it remained stable in the West, currently at 10%. In good news, test positivity declined in the South and Northeast, currently at 11.9% and 11.7%, respectively. This is the third consecutive week that test positivity has declined in the South, suggesting that this region has surpassed the seasonal peak.
Influenza
Influenza activity substantially increased across the country, as indicated by wastewater and clinical data. We expect additional increases in the coming weeks following the holidays.
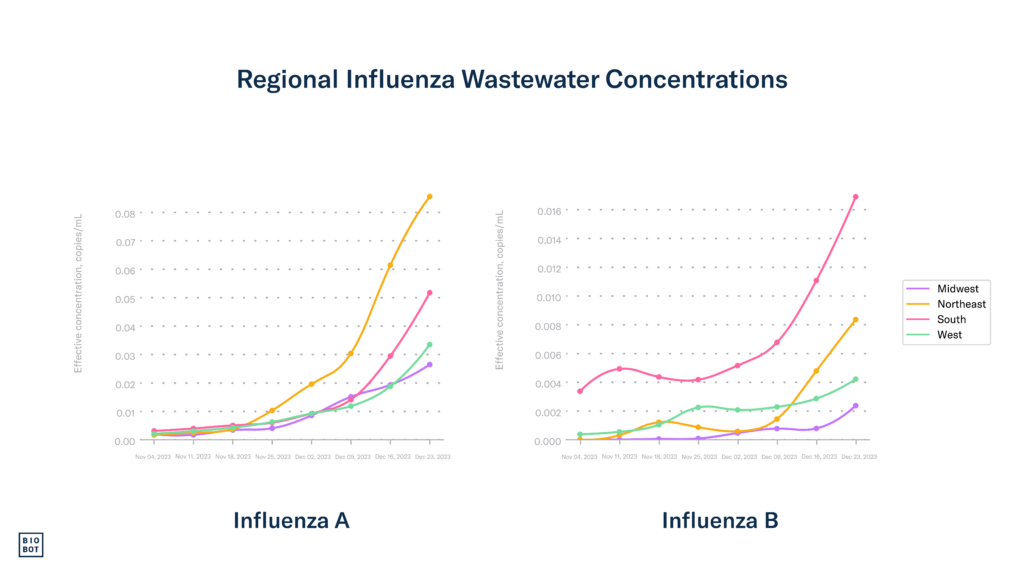
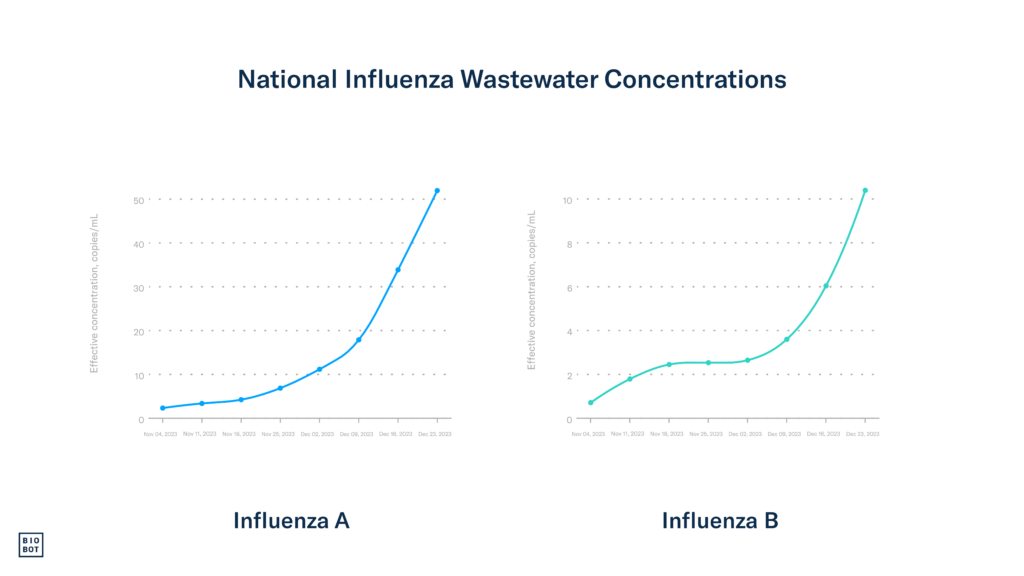
Wastewater data: Data as of December 23rd show another significant increase in influenza activity, with influenza A concentrations up by 41% and influenza B by 48%. This is the second consecutive week with influenza A wastewater increases greater than 40%.
All regions in the US experienced strong increases in influenza A and B concentrations last week, with the Northeast showing the highest concentrations of influenza A. This aligns with clinical data showing the greatest increases in influenza-like-illness hospitalizations occuring in the Northeast. Influenza A continues to be substantially more prevalent than influenza B in wastewater. Given the expected impact of holiday travel and gathering, we anticipate sustained increases in influenza wastewater concentrations in the coming weeks.
Clinical data: Nationally, influenza test positivity continues to grow, jumping from 10.2% to 12.8%. The number of influenza hospitalizations increased by more than 36%, totalling 9,825 admissions. The percentage of hospital visits for flu-like symptoms, common in flu, RSV, and COVID-19 patients, climbed from 4.4% to 5.1%. The consistent increases we’ve observed in flu activity over the past several weeks suggest that we should expect continued high flu activity for the time being.
Although the South and West continue to have the greatest rates of influenza-like-illness hospitalizations, rates in the Northeast significantly grew, where most states now report high or moderate activity levels. Influenza-like-illness activity continues to increase in the Midwest as well.
Most positive flu tests are influenza A, which continues to reflect what we see in wastewater. This indicates that the prevalence of influenza A is much higher than influenza B, which is the typical pattern we see most US influenza seasons.
COVID-19
COVID-19 activity and community viral load are increasing, and we expect these trends to continue following holiday travel and gathering.
Wastewater data: Wastewater concentrations for SARS-CoV-2, our earliest indicator for understanding COVID-19 trends, have been increasing across the country over the past eight weeks. As of December 16th (week 50), the national average is 997 copies/mL, which is 15% greater than it was last week (867 copies/mL). The national average concentration remains slightly lower than it was this time last year (~1,086 copies/mL).
The Northeast and the Midwest have the highest wastewater concentrations, marking substantial increases from the previous week. These increases were also reflected in clinical data, as test positivity grew in both the Northeast and the Midwest from CDC’s most recent data through December 16th.
We expect SARS-CoV-2 wastewater concentrations to increase in the coming weeks after increased holiday travel and gathering.
Clinical data: As of December 16th, the national COVID-19 tests positivity rate increased slightly from 11% to 11.7%. The Midwest (HHS region 7) continues to have the highest test positivity nationally, now at 18.5%, up from 17.2% the previous week. Test positivity rates are lowest in the South and West.
Hospitalizations and deaths attributed to COVID-19 show that disease burden is continuing to grow this season. Nationally, hospitalizations increased 10.4%, totaling 25,577 admissions during week 50, and the proportion of deaths attributed to COVID-19 increased to 3%.
Footnotes:
Wastewater data for RSV, influenza, and SARS-CoV-2 are from Biobot Analytics and are through December 23, 2023 (MMWR week 51). Clinical data on testing, hospitalizations, and emergency department visits for RSV, influenza, and COVID-19 are from the Centers for Disease Control and Prevention. Updates to clinical data for RSV, influenza, and COVID-19 are through December 16th, 2023 (MMWR week 50).