

Summary: Week of 2/12/24
Data from Biobot’s national wastewater network and clinical disease monitoring show that RSV and influenza A activity declined during week 6, while SARS-CoV-2 activity remained consistent. While these trends signal that we have made it through the peak of the respiratory season, week-over-week fluctuations suggest that respiratory virus circulation is still elevated, especially for SARS-CoV-2.
The Bottom Line: While we are headed in the right direction, the respiratory virus season is not over yet, and the chance of encountering COVID-19, influenza, or RSV is still elevated. Opting to stay in if you feel ill, using a mask in crowded spaces, and staying up to date with vaccinations are still ways to keep yourself and your loved ones healthy.
National Outlook
RSV
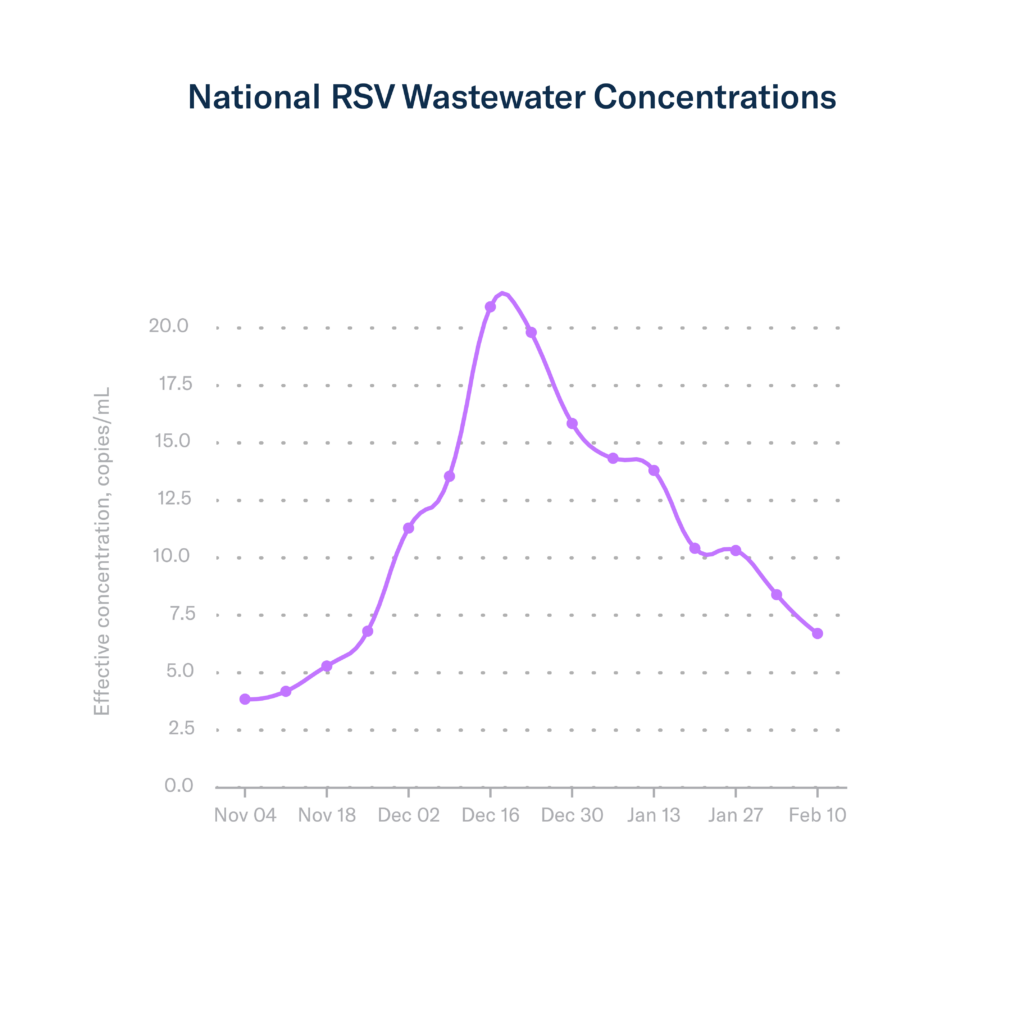
Nationally, RSV wastewater concentrations decreased again during week 6, marking a 20% decrease in concentration. We continue to get closer to the end of the RSV season.
Continuing the good news, clinical RSV metrics continue to decline. As of February 3rd (week 5), the percentage of PCR tests that are positive (test positivity) for RSV continues to decrease, going down from 6% the previous week to 5.5% currently. Hospitalization rates also continue to decline for all age groups.
Influenza
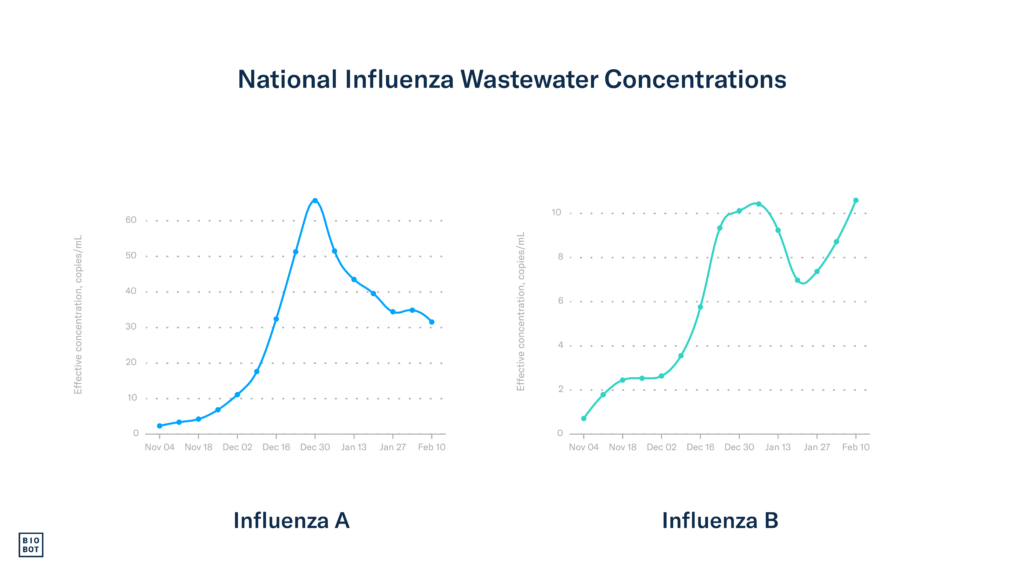
Data through week 6 show that wastewater concentrations for influenza A, which is driving most clinical burden in the US, began decreasing again, going down by 9.5%. Influenza B, which typically peaks later in the season than influenza A, continued to increase, going up by 16.2% in week 6. Wastewater concentrations for influenza are still relatively high, indicating that we can expect a couple more weeks of the influenza season.
In good news, declines in the number of hospitalizations due to influenza were larger in week 5 compared to week 4, going from around 12,200 hospitalizations to around 11,000 in week 5. The percentage of hospital visits for flu-like symptoms – typical in flu, RSV, and COVID-19 patients – did not substantially change, remaining around 4.4% in week 5, which is still above the CDC baseline for influenza-like illness. Influenza test positivity also did not significantly change, currently at 15.8% in week 5. These plateaus in clinical metrics align with the slight increase in wastewater concentrations we observed during week 5. With concentrations decreasing again in week 6, we hope that clinical metrics will follow and begin decreasing again soon.
COVID-19
Wastewater data show that COVID-19 activity and community viral load remained mostly stable from week 5 to week 6. As of February 10th (week 6), the national SARS-CoV-2 wastewater concentration average is 883 copies/mL.
In great news, all major COVID-19 clinical metrics declined during week 5. The national COVID-19 test positivity rate declined, going from 10.6% in week 4 to 10% in week 5. Hospitalizations continued to decline, going down by 10% in week 5, totaling 20,772 admissions. Deaths also declined by about 6%, currently representing 3.1% of deaths in the US. These downward trends in clinical metrics are great signs; however, the plateau we are observing with wastewater concentrations suggests that COVID-19 activity is still high and that we are not quite through this wave.
Regional
The South
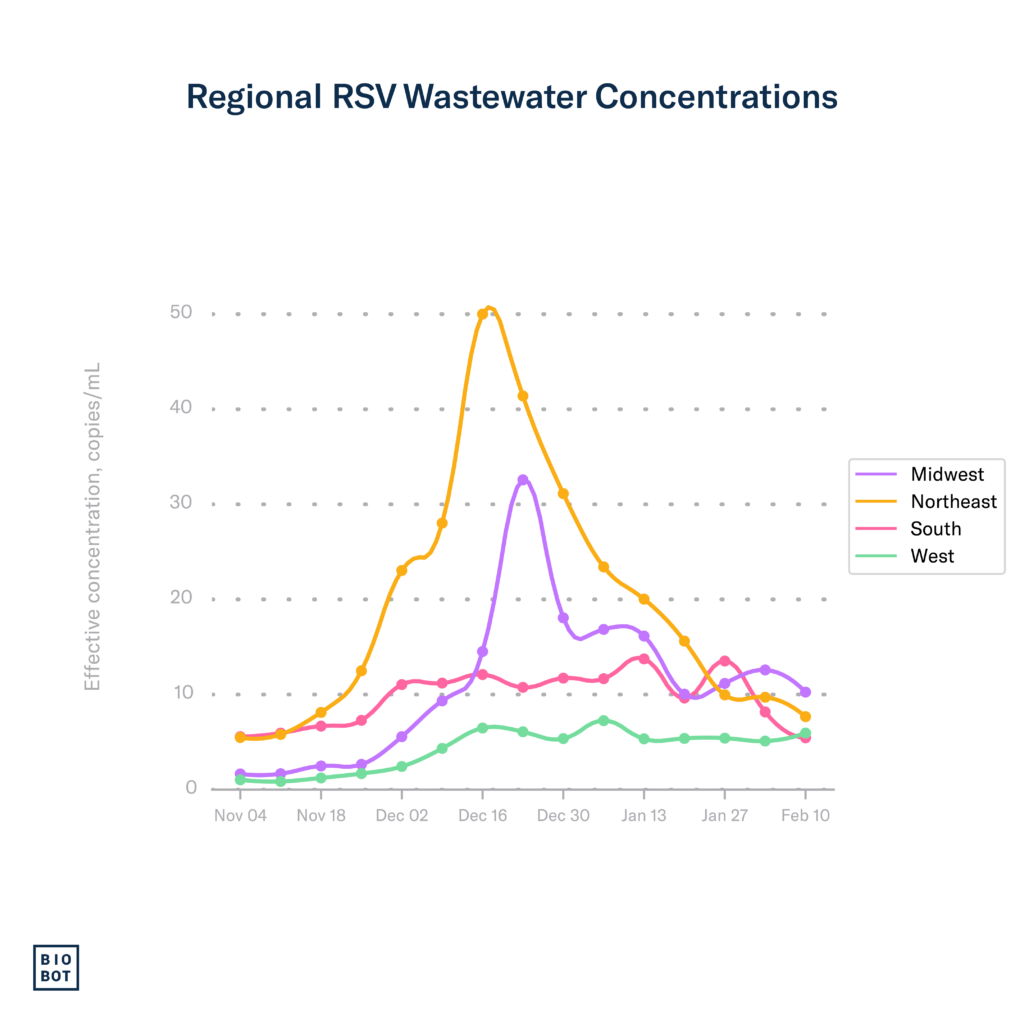
RSV: In great news, RSV wastewater concentrations decreased again in the South during week 6 and are now around the level they were early on in the season in late October. Clinical data show that test positivity continued to decline in the South during week 5, currently at 3%.
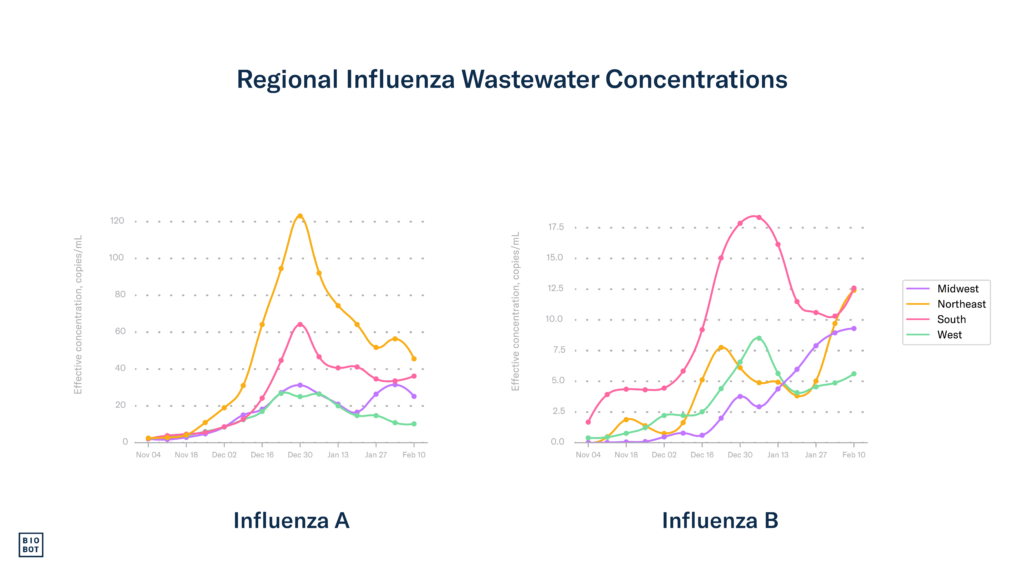
Influenza: Wastewater data through week 6 indicate a slight increase in concentrations of influenza A and a moderate increase in concentrations of influenza B in the South. Clinical metrics for influenza continued to have mixed signals during week 5. About half of states saw increases in influenza-like illness hospitalizations, with Oklahoma, Arkansas, and Texas having the greatest increases. The other states experienced moderate declines or remained stable. These increases indicate that there is still a good amount of influenza currently circulating in the South.
COVID-19: Wastewater concentrations slightly increased again during week 6 in the South, currently at 720 copies/mL. In good news, all states except Texas experienced a decrease in COVID-19 hospitalization rates during week 5. We hope that clinical trends aren’t influenced by the slight increases we are seeing in wastewater, but we’ll continue to keep an eye on the South.
The Midwest
RSV: In good news, RSV wastewater concentrations began decreasing again in the Midwest during week 6. Test positivity in the Midwest during week 5 continued to decline, dropping down to 7.4%. This is still a high value for test positivity, but the downward trend is encouraging.
Influenza: In good news, after two consecutive weeks of increase, the Midwest experienced a decrease in influenza A wastewater concentrations during week 6. The rate of increase for influenza B concentrations also began to slow, a welcome signal that the Midwest may be near the influenza B peak. During week 5, several states in the Midwest experienced an increase in influenza-like illness hospitalizations, with Iowa, Kansas, and Michigan reporting the greatest increases. These increases in hospitalizations mirror what we’re observing with increases in wastewater.
COVID-19: The Midwest experienced another week of slight increases in SARS-CoV-2 concentrations during week 6, currently at 743 copies/mL. In general, things are continuing to look good in the Midwest, with most states experiencing decreases in COVID-19 hospitalizations. We hope that these clinical trends continue but will keep an eye on the region to see if their direction changes following slight increases in wastewater concentrations.
The Northeast
RSV: After a brief plateau, RSV concentrations began declining again in the Northeast. The declining trend in test positivity we observed over the past weeks continued during week 5, now down to 4.1%. Relatively low wastewater concentrations and test positivity indicate that the Northeast is nearing the end of its RSV season.
Influenza: Influenza A concentrations began decreasing again in the Northeast, while influenza B concentrations continued to increase. As we anticipated following increases in wastewater concentrations during week 5, most states in the Northeast also experienced an increase in influenza-like illness hospitalizations during week 5, with Vermont, Rhode Island, and New Hampshire having the greatest increases. We hope that these trends will quickly shift downward following declines in influenza A wastewater concentrations.
COVID-19: SARS-CoV-2 wastewater concentrations decreased slightly in the Northeast during week 6, with current concentrations at 1,284 copies/mL. Following increases in wastewater concentrations during week 5, clinical data in the Northeast showed some signs of an uptick in activity. In week 5, while most Northeastern states experienced a decrease in COVID-19 hospitalizations, Maine and New Hampshire experienced increases. We will continue to keep an eye on the region.
The West
RSV: The West saw a slight uptick in RSV wastewater concentrations during week 6 but remained low overall. RSV test positivity continued to decline in the West during week 5 and is currently at 5.7%.
Influenza: In the West, wastewater concentrations for influenza A slightly declined while concentrations of influenza B increased. Clinical data through week 5 show that most states in the West experienced a decrease in influenza-like illness hospitalization rates again; however, Alaska and Wyoming saw moderate increases. Overall, the West is heading in the right direction towards declining influenza activity.
COVID-19: SARS-CoV-2 wastewater concentrations in the West increased slightly during week 6, currently at 559 copies/mL. In terms of clinical data, the West continues to head in the right direction as most Western states experienced a decrease in COVID-19 hospitalization rates during week 5, while a couple experienced increases (Alaska, Wyoming, and New Mexico).
Footnotes:
Wastewater data from Biobot Analytics for RSV, influenza, and SARS-CoV-2 are through February 10, 2024 (MMWR week 6). Clinical data on testing, hospitalizations, and emergency department visits for RSV, influenza, and COVID-19 are from the Centers for Disease Control and Prevention. Updates to clinical data for RSV, influenza, and COVID-19 are through February 3, 2024 (MMWR week 5).