
Summary: Week of 2/5/24
Data from Biobot’s national wastewater network and clinical disease monitoring show that RSV activity declined during week 5, while influenza and SARS-CoV-2 activity increased slightly. Despite these small fluctuations week over week, the trajectory for all three major respiratory viruses continues downward, indicating that we have made it through the peak of the respiratory virus season in the US. We likely still have a couple more weeks of elevated influenza and COVID-19 activity, as indicated by trends in wastewater and clinical data, but we are close to the end of the RSV season.
The Bottom Line: We continue to navigate through the respiratory virus season, where the likelihood of being exposed to COVID-19, influenza, or RSV remains elevated. Taking preventative measures to limit your exposure and enhance your immune defenses is essential in lowering your risk of illness. Opting to stay home if you feel unwell, using a mask in densely populated areas, and ensuring you are vaccinated are still wise choices at this time.
National Outlook
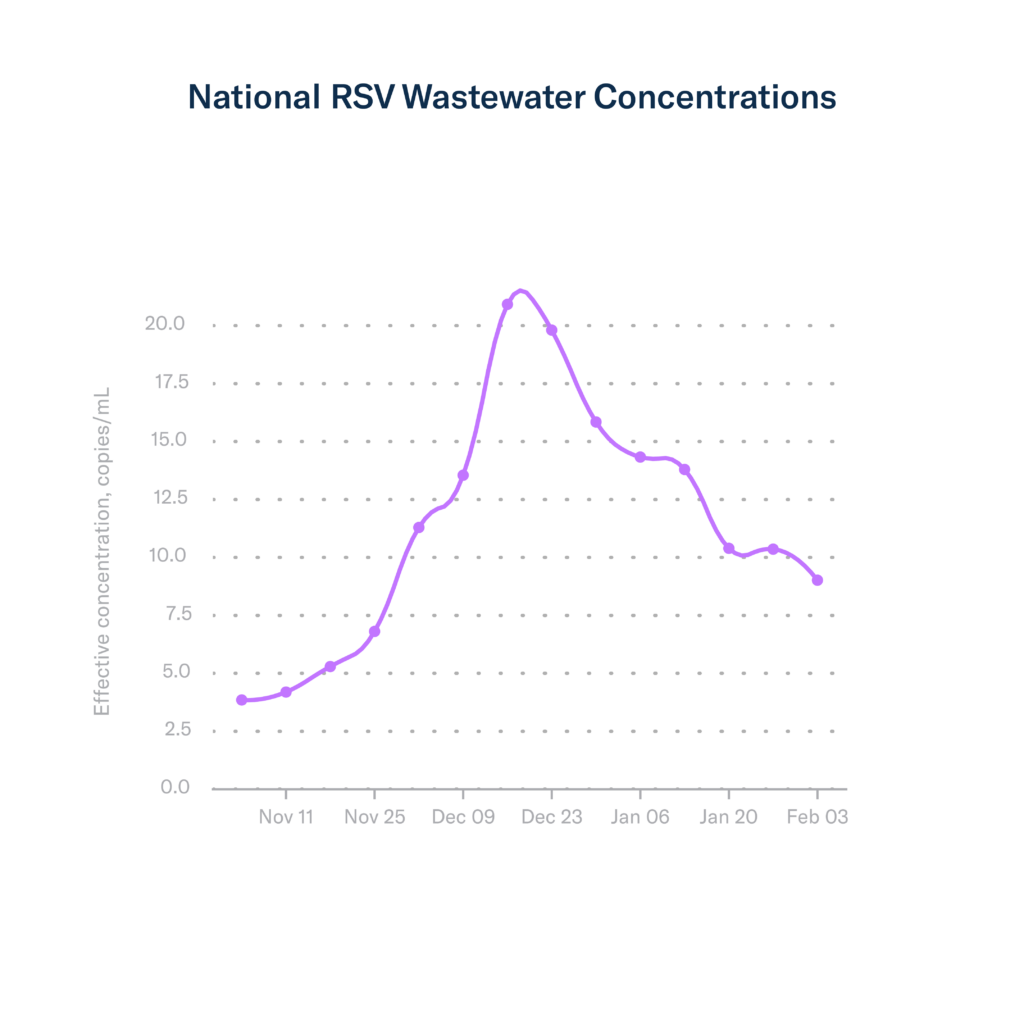
RSV
Nationally, RSV wastewater concentrations began decreasing again during week 5, marking a 13.5% decrease in concentration. In great news, the shape of the wastewater epidemiologic curve suggests that we are approaching the end of the RSV season.
Continuing the good news, despite the small uptick in RSV wastewater concentrations observed last week in week 4, clinical metrics still declined. As of January 27th (week 4), the percentage of PCR tests that are positive (test positivity) for RSV continues to decrease, going down from 7.3% the previous week to 6% currently. Hospitalization rates also continue to decline for all age groups.
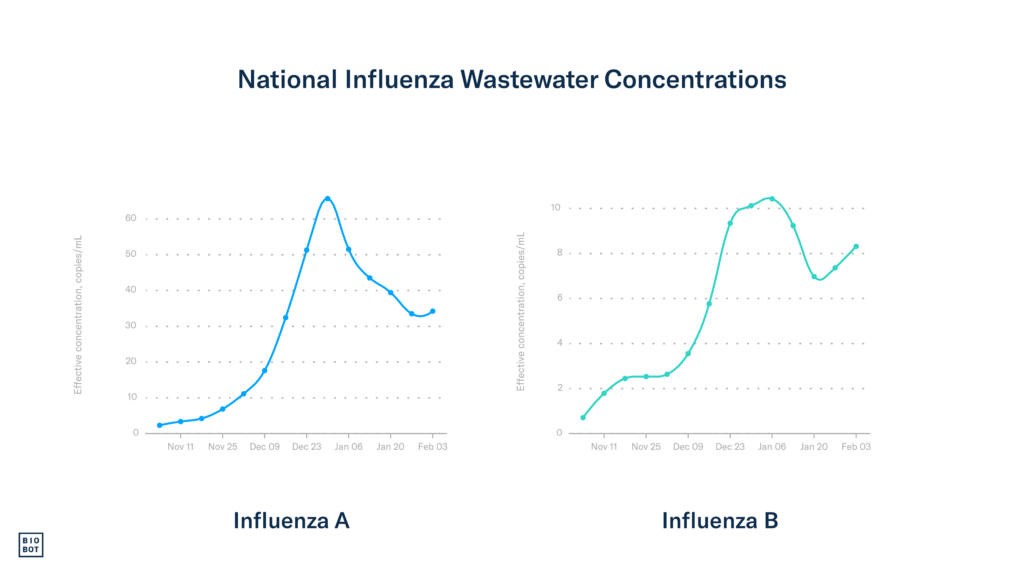
Influenza
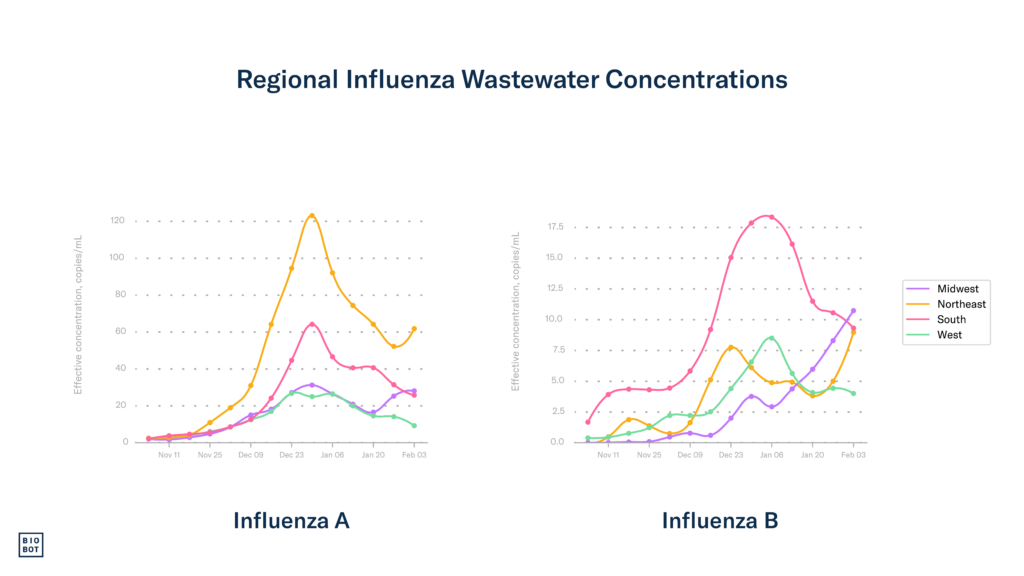
As of February 3rd (week 5), data show that wastewater concentrations for influenza A, which is driving most transmission in the US, increased slightly by 2.1%. Influenza B, which typically peaks later in the season than influenza A, saw increases in wastewater concentrations as well, increasing by 12.1% in week 5. These increases indicate that influenza activity is still relatively high and that we can expect a couple more weeks of the influenza season.
While some clinical influenza metrics continue to decline, others increased, indicating that influenza activity remains high. The number of hospitalizations due to influenza slightly declined in week 4, going from around 12,500 hospitalizations in week 3 to around 12,200 in week 4. The percentage of hospital visits for flu-like symptoms – typical in flu, RSV, and COVID-19 patients – did not substantially change, remaining around 4.3% in week 4. There was a slight increase in influenza test positivity, up from 14.2% in week 3 to 16.2% in week 4. Increases in wastewater concentrations for influenza A and B and the lack of consistent decreases across clinical influenza metrics indicate that flu activity is still elevated and that now is still a good time to take precautions to keep yourself and your loved ones healthy.
COVID-19
Wastewater data show that COVID-19 activity and community viral load have slightly increased during week 5, a departure from the declining trend observed in the previous weeks. As of February 3rd (week 5), the national SARS-CoV-2 wastewater concentration average is 893 copies/mL.
Almost all COVID-19 clinical metrics continue to decrease as of January 27th (week 4). The national COVID-19 test positivity rate had a big decline, going from 10.8% in week 3 to 6.3% in week 4. Hospitalizations continued to decline, going down by 10.9% in week 4, totaling 22,636 admissions, while deaths did not change, continuing to make up about 3.6% of all deaths in the US. The increases in wastewater concentrations we observed suggest that COVID-19 activity is still high and that we are not through this wave yet. We are keeping an eye on the clinical data to see if they respond to these increases, although we hope they continue their downward trend.
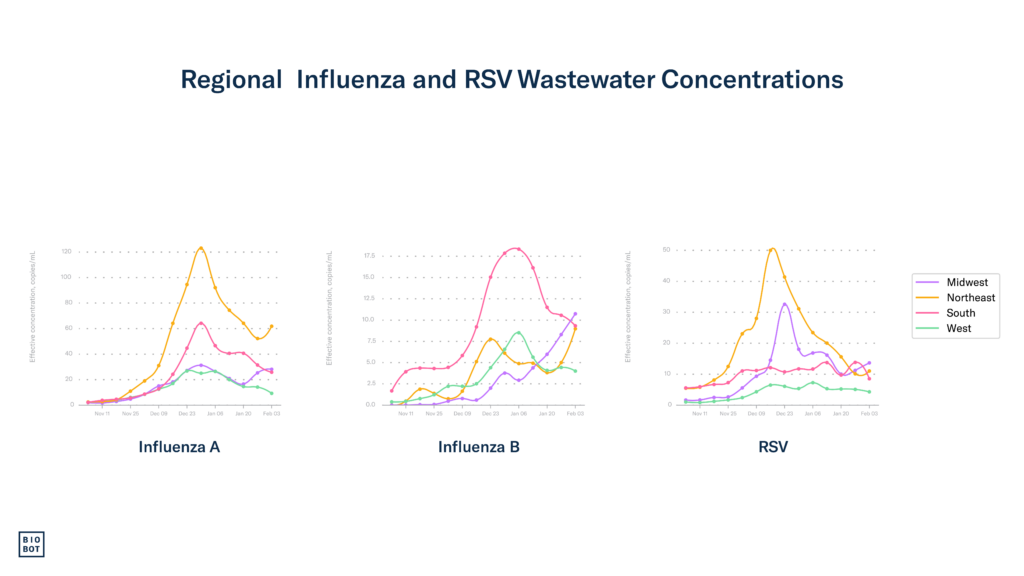
Regional
The South
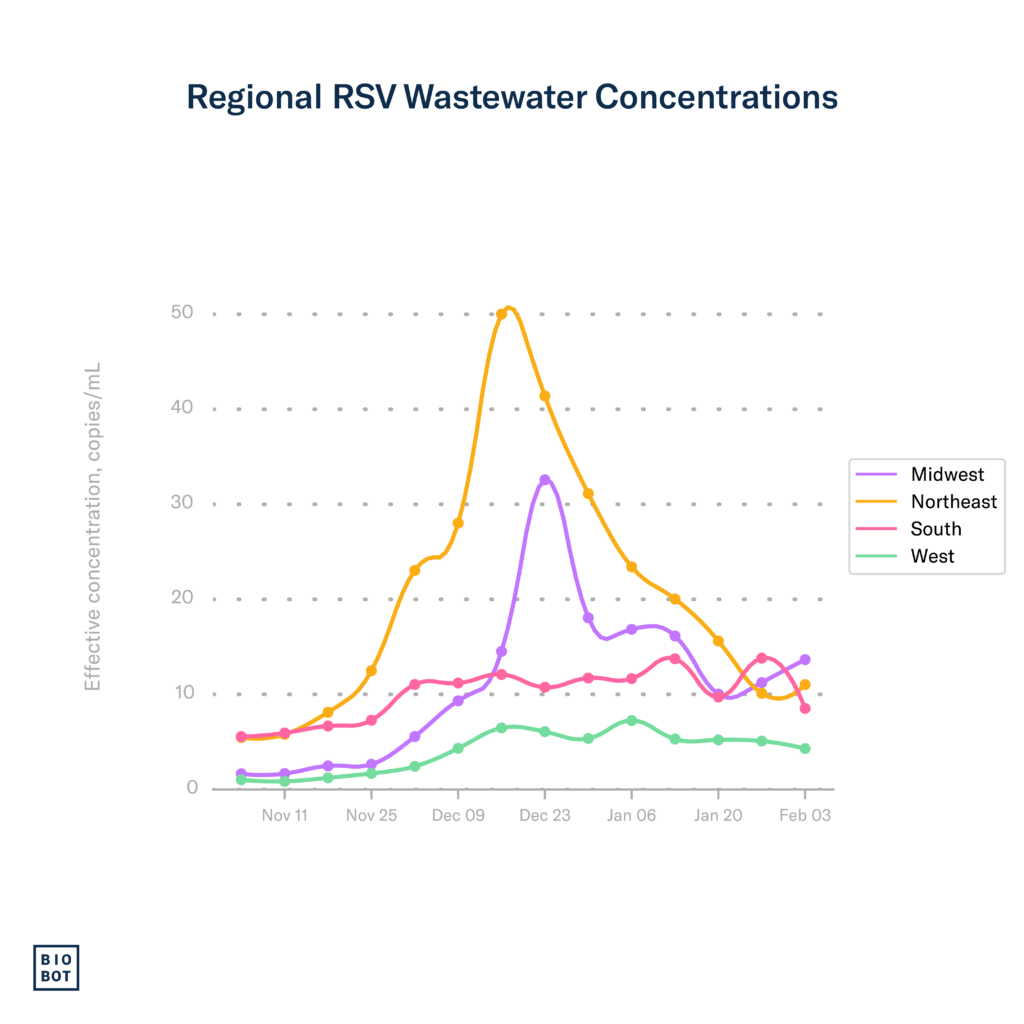
RSV: In welcome news, RSV wastewater concentrations began decreasing again in the South during week 5. Clinical data show test positivity continued to decline in the South during week 4, currently at 3.3%, which is close to what it was at the beginning of the season in September. It appears that the end of the RSV season in the South is very close.
Influenza: Wastewater data through week 5 show that wastewater concentrations for influenza A continued to decrease in the South, while clinical metrics for influenza continue to be a mixed bag. Some states (namely Oklahoma, Georgia, Texas, and Washington DC) saw increases in influenza-like illness hospitalizations during week 4, while others, like Tennessee, Maryland, and Mississippi, saw larger declines.
COVID-19: Wastewater concentrations slightly increased during week 5 in the South, currently at 702 copies/mL. Most states in the South saw some decreases in COVID-19 hospitalization rates; however, five states (Texas, Louisiana, Alabama, Georgia, and Florida) saw increases. These increases in hospitalization rates track with a plateau in wastewater concentrations observed over the past three weeks in the South.
The Midwest
RSV: RSV wastewater concentrations slightly increased again in the Midwest during week 5, suggesting that activity is still ongoing and elevated. Test positivity in the Midwest during week 4 continued to decline, dropping from 10.3% to 8.4%. This is still a high value for test positivity, yet the downward trend is encouraging, indicating that RSV activity continues to wane.
Influenza: The Midwest experienced another slight increase in influenza A wastewater concentrations during week 5 and a steady increase in influenza B concentrations. It is typical for influenza B to peak later in the respiratory virus season than influenza A, so these increases in influenza B wastewater concentrations are not surprising. During week 4, most states in the Midwest experienced a slight increase in influenza-like illness hospitalizations, which tracks the increases in wastewater concentrations we’ve observed in the Midwest over the past two weeks.
COVID-19: Like the South and Northeast, SARS-CoV-2 wastewater concentrations slightly increased in the Midwest during week 5, currently at 715 copies/mL. In better news, hospitalization rates for COVID-19 continued to decline in all Midwestern states during week 4. With these slight increases in wastewater concentrations, we’ll be keeping an eye on clinical data in the Midwest to see if it responds in the coming weeks.
The Northeast
RSV: Data through week 5 show that RSV concentrations slightly increased in the Northeast. The declining trend in test positivity we observed over the past weeks continued, going down from 5.3% to 4.9% in week 4. Relatively low wastewater concentrations and test positivity indicate that the Northeast is nearing the end of its RSV season.
Influenza: In a departure from recent trends, data through week 5 show that influenza A and influenza B wastewater concentrations increased in the Northeast. Most Northeastern states are still in the low influenza-like illness hospitalization categories, a couple of states are in the moderate category, and Massachusetts and New Jersey remain in the high category. We will be keeping an eye on the Northeast to see if clinical metrics go up in response to increases in influenza wastewater concentrations.
COVID-19: Similar to other regions, SARS-CoV-2 wastewater concentrations increased in the Northeast during week 5, with current concentrations at 1,304 copies/mL. All Northeastern states except for Vermont experienced a decrease in COVID-19 hospitalization rates during week 4. Like other regions with increasing wastewater concentrations, we will be keeping an eye on the Northeast to see if clinical metrics respond to increases in wastewater concentrations over the next couple of weeks.
The West
RSV: RSV wastewater concentrations slightly declined in the West during week 5 and have been consistently low throughout the season. In good news, the decreasing trend in test positivity we observed for the previous four weeks in the West has continued, with a reduction from 6.5% to 6.0% in week 4.
Influenza: In the West, wastewater concentrations for influenza A and B began decreasing again during week 5 and remained low overall. Clinical data through week 4 show that most states in the West experienced a decrease in influenza-like illness hospitalization rates; however, Wyoming and New Mexico saw relatively large increases. We hope that these clinical metrics decline in these states soon, but in general, the West is heading in the right direction toward declining influenza activity.
COVID-19: SARS-CoV-2 wastewater concentrations in the West did not change during week 5, currently at 511 copies/mL. In good news, all Western states experienced a decrease in COVID-19 hospitalization rates during week 4. We hope that this declining trend continues.
Footnotes:
Wastewater data from Biobot Analytics for RSV, influenza, and SARS-CoV-2 are through February 3, 2024 (MMWR week 5). Clinical data on testing, hospitalizations, and emergency department visits for RSV, influenza, and COVID-19 are from the Centers for Disease Control and Prevention. Updates to clinical data for RSV, influenza, and COVID-19 are through January 27, 2023 (MMWR week 4).