
Note: We are making a second update to our blog this week to incorporate additional data that our stellar lab team processed. This second update only applies to influenza and RSV wastewater concentrations, which are now through January 13th (MMWR week 2). All other metrics remain unchanged.
Summary: Week of 1/15/24
Biobot’s national wastewater network brings good news this week, as wastewater and clinical data signal that we have likely made it past the seasonal peak for RSV and influenza and that increases in COVID-19 activity are beginning to slow down. Despite these encouraging signals, wastewater concentrations, test positivity, and hospitalizations remain elevated for all three major respiratory viruses.
The Bottom Line: While circulation of the three major respiratory illnesses – COVID-19, influenza, and RSV – appears to be slowing down, activity is still pretty high. It is not too late to take action to maintain your health and protect those around you from illness. Now is still a good time to consider staying home when you’re not feeling well, wearing a mask in crowded spaces, and getting vaccinated.
National Outlook
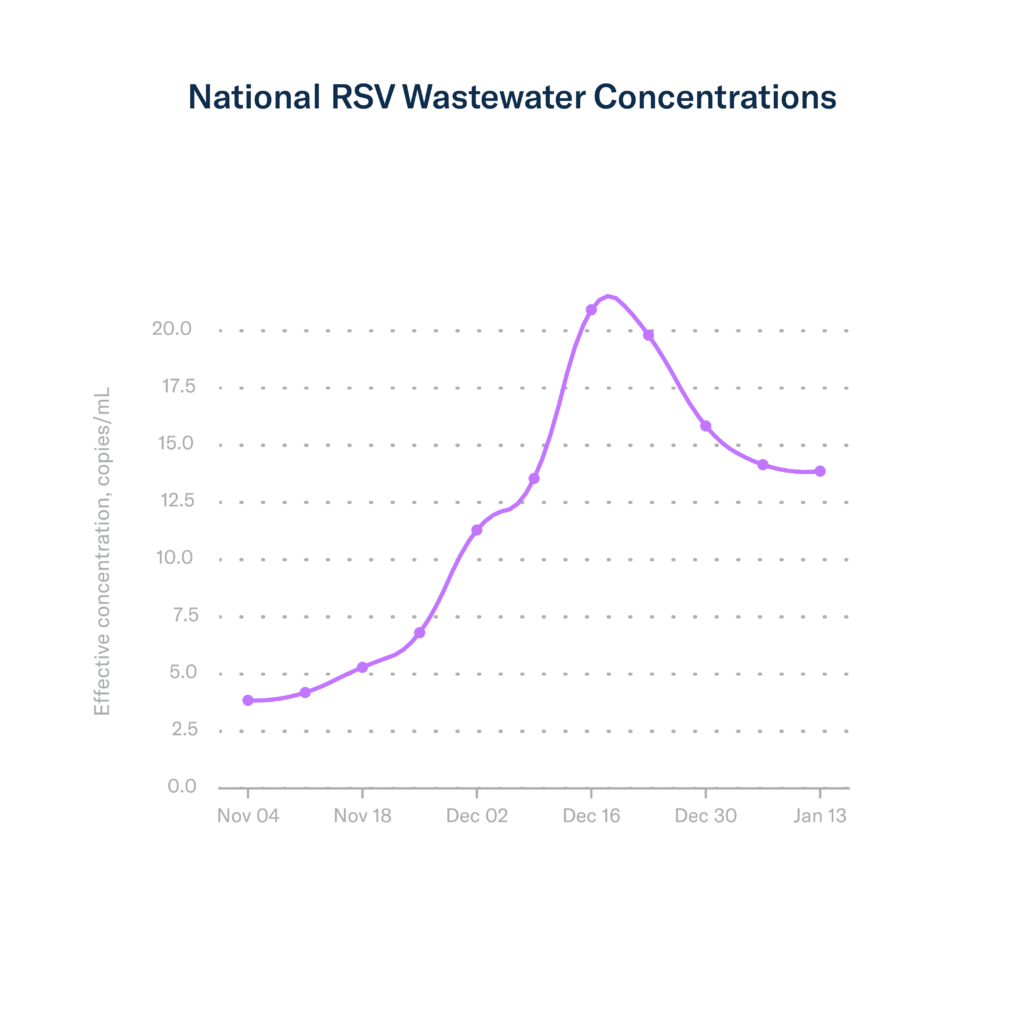
RSV
Nationally, RSV wastewater concentrations have declined for four consecutive weeks. As of January 13th (week 2), national wastewater data indicates a 3.5% decrease in RSV concentrations.
As of January 6th (week 1), the percentage of PCR tests that are positive (test positivity) for RSV continued to decrease, going down from 10.5% the previous week to 9.9% currently. In great news, hospitalization rates continue to decrease for all age groups. Despite all this good news, RSV activity still remains elevated.
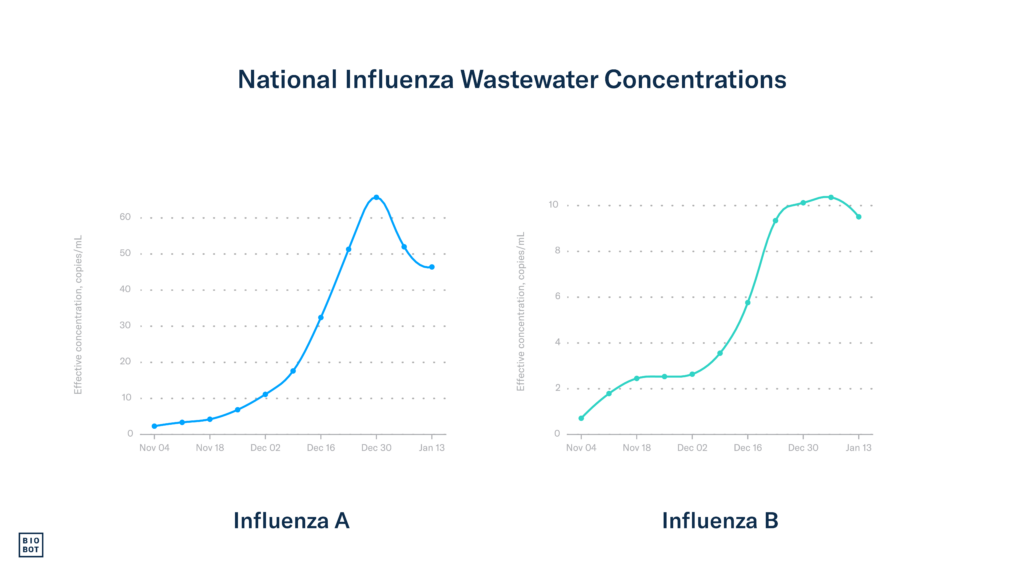
Influenza
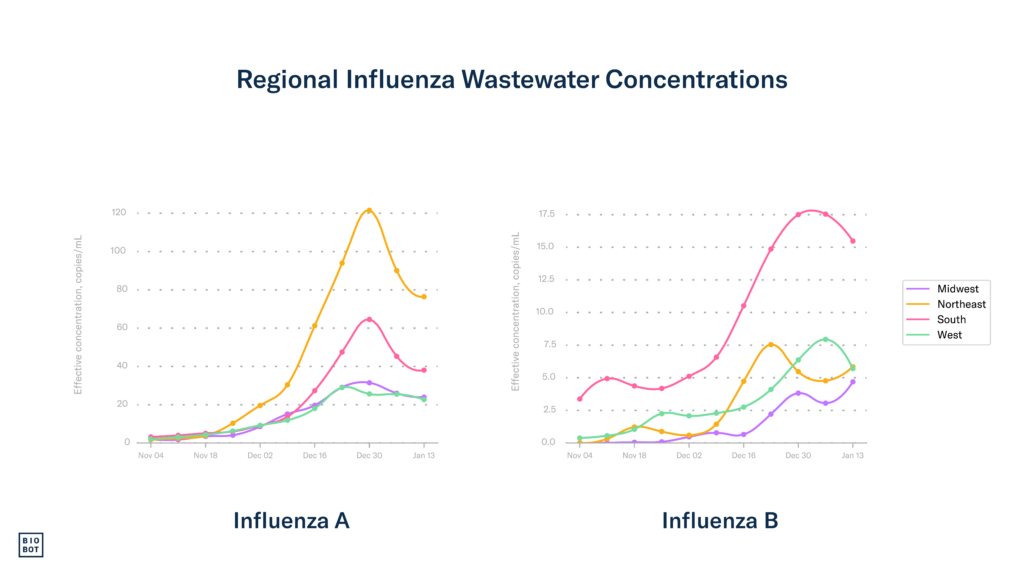
This is the second consecutive week that influenza activity appears to be decreasing since the beginning of the flu season, as indicated by wastewater data. As of January 13th (week 2), data show that wastewater concentrations for influenza A, which is driving most transmission in the US, have decreased by 11%, and those for influenza B decreased by 4.8%.
Clinical influenza data are also showing encouraging signs of a slowdown. Nationwide, for the first time this season, we see a decrease in influenza test positivity, going from 17.5% to 14% as of January 6th (week 1). The number of hospitalizations due to influenza decreased slightly in week 1, with 18,526 influenza hospitalizations. The percentage of hospital visits for flu-like symptoms – typical in flu, RSV, and COVID-19 patients – decreased from 6.9% to 5.7%. Most positive flu tests continue to be influenza A, which has consistently been reflected in wastewater data. While it is good news that all three of these clinical metrics have declined in the past week, we are still not out of the woods yet, as influenza activity still remains quite high.
COVID-19
Wastewater data show that COVID-19 activity and community viral load have decreased over the previous two weeks, signaling that post-holiday transmission is slowing down and that we might be past the peak of this COVID-19 wave.
Wastewater concentrations for SARS-CoV-2, our earliest indicator for understanding COVID-19 trends, have finally decreased since this wave began in October. As of January 13th (week 2), the national average is 1,132 copies/mL. While the national average concentration is still higher than it was this time last year (~828 copies/mL), it is important to note that circulating variants, symptom profiles, and community vaccination rates, among other variables, may all influence the amount of virus shed into wastewater.
While RSV and influenza clinical metrics are decreasing, some COVID-19 metrics have plateaued while others have increased. As of January 6th (week 1), the national COVID-19 test positivity rate remained stable and is currently at 12.7%. Hospitalizations and deaths attributed to COVID-19 show that the disease burden continues to grow. Nationwide, hospitalizations slightly increased, up 3.2%, totaling 35,801 admissions during week 1, and the proportion of deaths attributed to COVID-19 increased to 14.3%. These differences in trends between wastewater and hospitalizations and deaths are not surprising, as wastewater data is currently one week ahead of clinical COVID-19 data, and changing trends in hospitalizations and deaths are typically lagged by a week or two. We anticipate and hope that hospitalization and death rates will begin to decrease in the coming weeks.
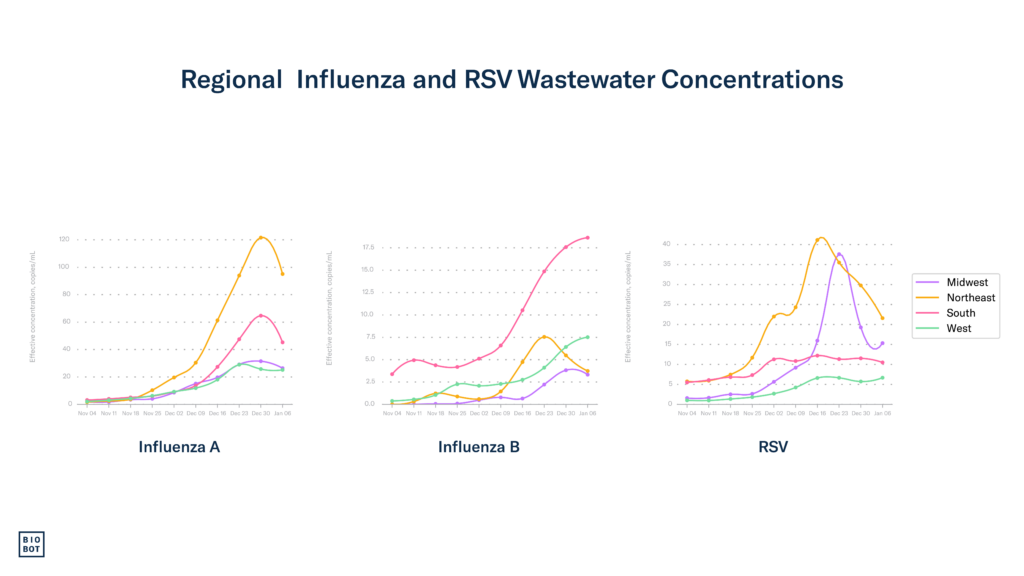
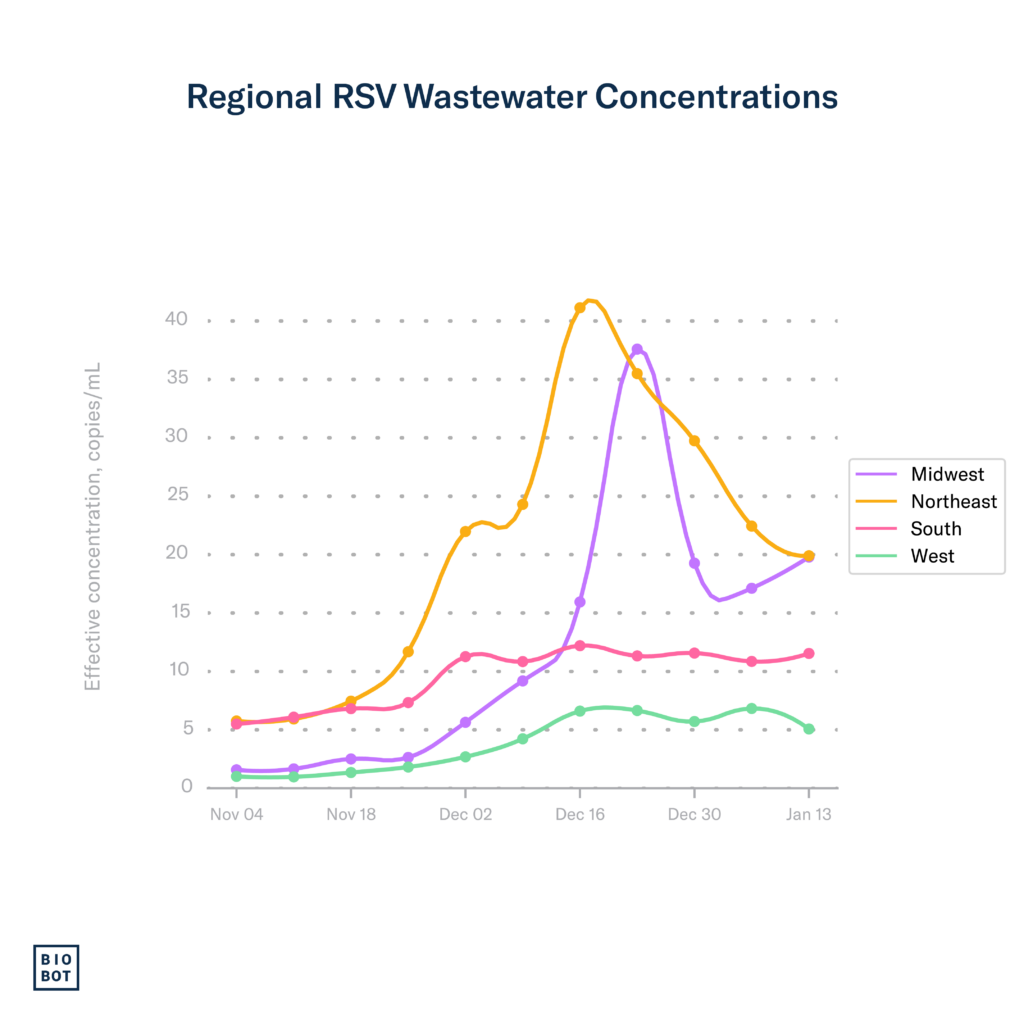
Regional
The South
RSV: RSV wastewater concentrations plateaued in the South during week 2, suggesting there hasn’t been much change in community viral load in the previous week. Clinical data through week 1 show that test positivity declined from 8.1% to 7.3%.
Influenza: Wastewater data through week 2 show that the South experienced decreases in wastewater concentrations for influenza A and B. Despite national decreases in influenza activity, the South continues to have the highest rates of influenza-like-illness hospitalizations as of week 1, with 4 states in the very high ILI category and several in the high category.
COVID-19: Wastewater concentrations decreased slightly in the South through week 2. Test positivity in the South increased slightly in week 1 and is currently around 10%. About half of Southern states experienced an increase in COVID-19 hospitalizations, while the other half did not experience a change. As wastewater data is one week ahead of clinical COVID-19 data, we will keep an eye on the South to see if clinical data follows the declining trend we are seeing in wastewater concentrations.
The Midwest
RSV: This is the second consecutive week the Midwest has experienced declining RSV wastewater concentrations, suggesting that they are through the worst of their RSV season. Test positivity also slightly declined in the Midwest during week 1, going from 14.1% to 13.3%. We hope that these declining trends continue as RSV activity remains quite high in the Midwest
Influenza: The Midwest, which has had lower wastewater concentrations than other regions this season, experienced a slight decrease in influenza A and B wastewater concentrations. Most states in the Midwest are now in the moderate and high categories for influenza-like-illness hospitalizations, but hospitalization rates also appear to be declining.
COVID-19: SARS-CoV-2 wastewater concentrations continued to decline slightly in the Midwest during week 2, currently at 1,146 copies/mL. These declines are also reflected in test positivity, which declined in the Midwest in week 1.
The Northeast
RSV: Data through week 2 show that RSV concentrations continue to decline in the Northeast, which is also reflected in test positivity which went down from 9.1% to 7.9% in week 1. These consecutive declines in wastewater concentrations and test positivity signal that the Northeast has made it past its RSV seasonal peak.
Influenza: Data through week 2 show that influenza A wastewater concentrations have declined for two consecutive weeks in the Northeast, while influenza B concentrations slightly increased last week. Clinical data through week 1 show that most states in the Northeast are in the high influenza-like-illness hospitalization category, with two in the very high category. If wastewater concentrations continue to decline, we expect hospitalization to decline as well in the coming weeks.
COVID-19: The Northeast also experienced a decline in SARS-CoV-2 wastewater concentrations during week 2, with current concentrations at 1,804 copies/mL. Despite these decreases in wastewater concentrations, the Northeast had the highest test positivity in the country during week 1, between 12% and 15%. During trend changes (for example, increasing activity to decreasing activity), it is expected that there will be some discordance between wastewater and clinical data, as wastewater data is currently one week ahead of clinical COVID-19 data.
The West
RSV: RSV wastewater concentrations slightly decreased in the West during week 2 and remain lower than all other regions. The decreasing trend in test positivity we observed last week in the West has continued, with a reduction from 9.5% to 9.1% in week 1.
Influenza: In the West, wastewater concentrations for influenza A and B slightly decreased during week 2. Clinical data through week 1 show that most states in the West are in the high influenza-like-illness hospitalization category.
COVID-19: SARS-CoV-2 wastewater concentrations did not change in the West during week 2. Test positivity decreased in the West during week 1 and is currently between 8% and 10%. Overall, the West appears to have had fewer extreme changes in wastewater and clinical data compared to other parts of the country this season so far.
Footnotes:
Wastewater data from Biobot Analytics for RSV, influenza, and SARS-CoV-2 are through January 13, 2024 (MMWR week 2). Clinical data on testing, hospitalizations, and emergency department visits for RSV, influenza, and COVID-19 are from the Centers for Disease Control and Prevention. Updates to clinical data for RSV, influenza, and COVID-19 are through January 6th, 2023 (MMWR week 1).