
Summary: Week of 1/22/24
Biobot’s national wastewater network continues to bring good news this week, as wastewater and clinical data signal that RSV, influenza, and COVID-19 activity in the US are on the decline. Even with these encouraging signals, wastewater concentrations, test positivity, and hospitalizations remain elevated for all three major respiratory viruses.
The Bottom Line: While circulation of the three major respiratory illnesses – COVID-19, influenza, and RSV – appears to be slowing down, we are very much still in the respiratory season, and transmission remains high. It is not too late to take action to maintain your health and protect those around you from illness. Now is still a good time to consider staying home when you’re not feeling well, wearing a mask in crowded spaces, and getting vaccinated.
National Outlook
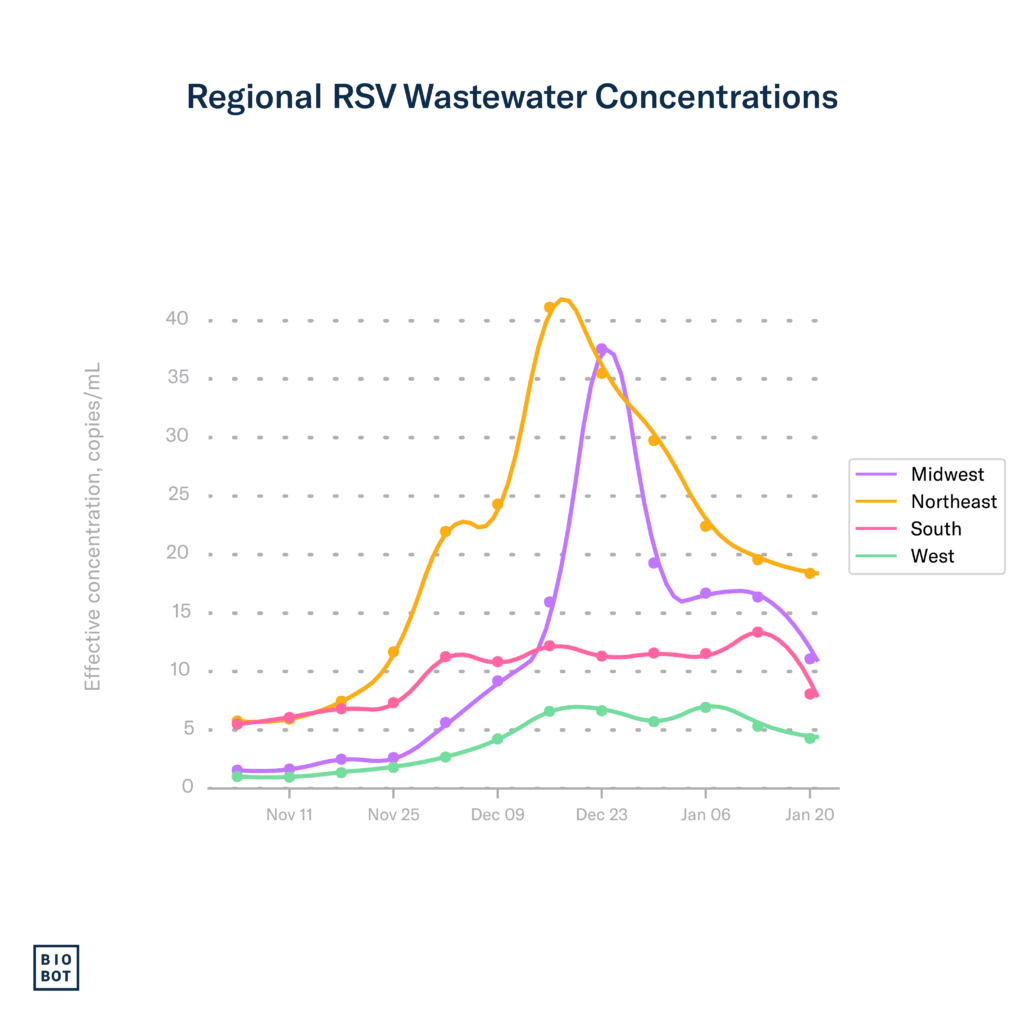
RSV
Nationally, RSV wastewater concentrations have declined for five consecutive weeks, increasing our confidence that we have surpassed the seasonal peak. As of January 20th (week 3), national wastewater data indicates a 24.6% decrease in RSV concentrations.
Mirroring wastewater concentrations, as of January 13th (week 2), the percentage of PCR tests that are positive (test positivity) for RSV continued to decrease, going down from 9.9% the previous week to 8.4% currently. In fantastic news, hospitalization rates continue to decrease for all age groups, with the 0-4-year-old age group experiencing the greatest decline. Even with these positive signals that RSV activity is slowing down, we are still in the RSV season, and activity remains elevated.

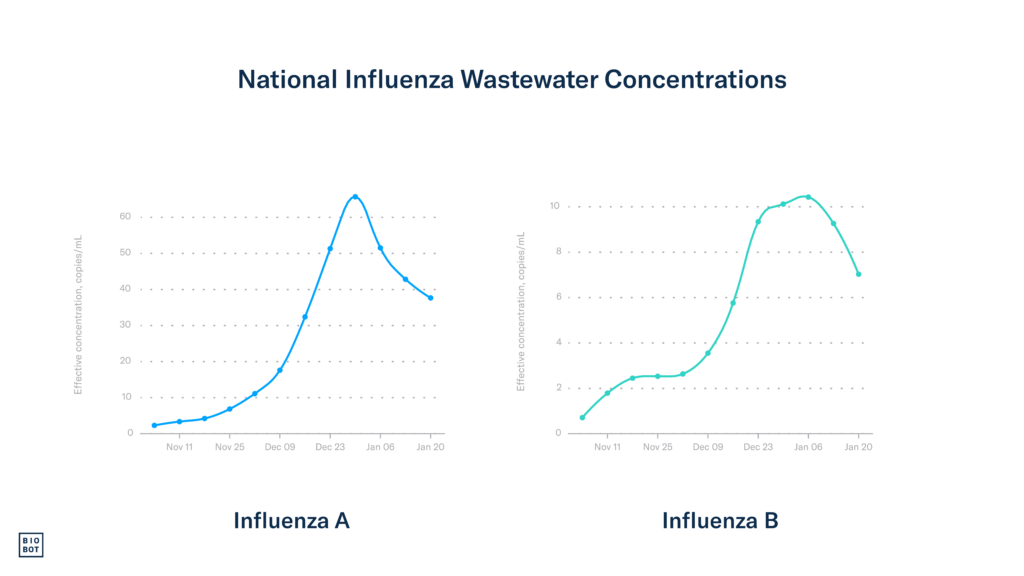
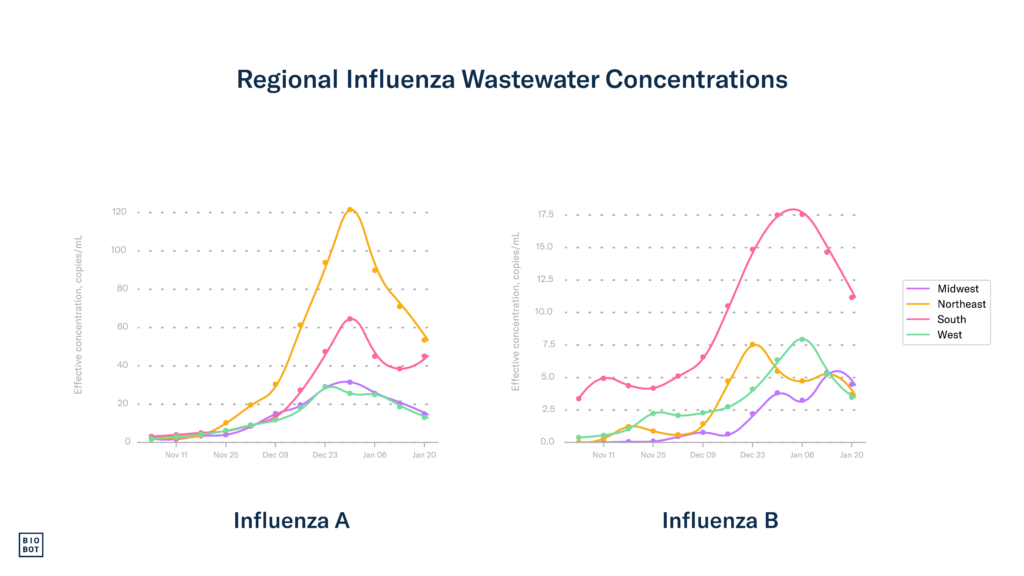
Influenza
In great news, this is the third consecutive week that influenza activity decreased since the beginning of the flu season, as indicated by wastewater data. As of January 20th (week 3), data show that wastewater concentrations for influenza A, which is driving most transmission in the US, have decreased by 11.9%, and those for influenza B decreased by 24.7%.
Clinical influenza data continue to mirror wastewater trends and show encouraging signs of a slowdown in influenza activity. Nationwide, we had another week where influenza test positivity did not increase, remaining stable at 13.7% as of January 13th (week 2). The number of hospitalizations due to influenza decreased markedly, going from greater than 18,000 hospitalizations in week 1 to 14,874 influenza hospitalizations in week 2. The percentage of hospital visits for flu-like symptoms – typical in flu, RSV, and COVID-19 patients – also continues to decrease, going from 5.7% to 4.7% in week 2. Most positive flu tests continue to be influenza A, which has consistently been reflected in wastewater data.
While it is great to see hospitalizations and influenza-like illness declining, the minimal change in test positivity and relatively high wastewater concentrations indicate that influenza transmission is still high, and that we should continue to take action to keep ourselves and loved ones healthy.
COVID-19
Wastewater data show that COVID-19 activity and community viral load have decreased over the previous three weeks, a welcome signal that we have likely made it through the worst of this COVID-19 wave. As of January 20th (week 3), the national SARS-CoV-2 wastewater concentration average is 882 copies/mL. While the national average concentration is still higher than it was this time last year (~759 copies/mL), it is important to note that circulating variants, symptom profiles, and community vaccination rates, among other variables, may all influence the amount of virus shed into wastewater.
Most COVID-19 metrics show good signs of decreasing as of January 13th (week 2). The national COVID-19 test positivity rate slightly declined during week 2, currently at 11.8%. While hospitalizations decreased nationwide, down 9.6%, totaling 32,861 admissions during week 2, the proportion of deaths attributed to COVID-19 increased by 10.3%. During week 2, 4.3% of all deaths in the US were due to COVID-19. This discordance with wastewater, hospitalizations, and death trends is not surprising during periods of trend change (e.g., going from increasing transmission to decreasing), as hospitalizations and deaths are considered lagging indicators. This is caused by delays between when people are infected, when symptoms become severe enough to visit the hospital, and when deaths might occur after that. Additionally, wastewater data is currently one week ahead of clinical COVID-19 data. We anticipate and hope that hospitalization and death rates will begin to decrease in the coming weeks.
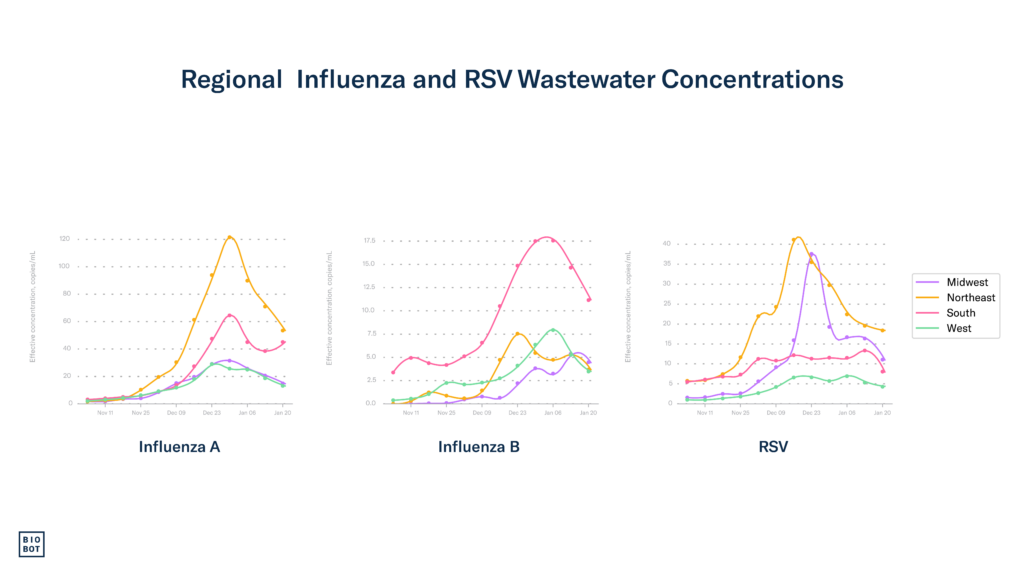
Regional
The South
RSV: RSV wastewater concentrations decreased in the South during week 3, in line with clinical data, which showed test positivity declining during week 2, going from 7.0% to 5.3%.
Influenza: Wastewater data through week 3 show that the South experienced a slight increase in wastewater concentrations for influenza A, suggesting that influenza activity is ongoing despite declining levels in recent weeks. Clinical data through week 2 (a week behind wastewater data) show that the South experienced a decrease in influenza-like illness hospitalizations, down from 4 states in the very high ILI category during week 1 to only one in week 2 (Tennessee). Even with these declines, the South continues to have the highest rates of influenza-like illness hospitalizations in the country. Wastewater and clinical data suggest that the South is not quite out of the woods with influenza.
COVID-19: Wastewater concentrations continued to decrease in the South through week 3, currently at 696 copies/mL. Test positivity in the South did not change in week 2 and is currently around 10%. As we anticipated, hospitalization rates for COVID-19 began to decline in the South during week 2 following declining wastewater concentrations. During week 2, most Southern states experienced a slight decrease in COVID-19 hospitalizations.
The Midwest
RSV: After RSV wastewater concentrations plateaued in the Midwest the previous two weeks, we are happy to report that concentrations have begun decreasing again during week 3. Test positivity in the Midwest during week 2 is also showing some positive signs of slowing down, having declined slightly from 12.9% to 12.3%. This is still a high value for test positivity, and we hope that this declining trend continues.
Influenza: The Midwest, which has had lower wastewater concentrations than other regions this season, continued to have decreasing concentrations of influenza A in week 3. Influenza B concentrations also began to decline during week 3. During week 2, most states in the Midwest experienced a decrease in influenza-like illness hospitalizations, with most now in the low or moderate categories. This is all great news for the Midwest.
COVID-19: SARS-CoV-2 wastewater concentrations continued to decline slightly in the Midwest during week 2, currently at 884 copies/mL. While test positivity remains high between 12-14% in the Midwest, it appears to be declining in week 2. In great news, hospitalization rates for COVID-19 declined in all Midwestern states during week 2, mirroring declines in wastewater concentration.
The Northeast
RSV: Data through week 3 show that RSV concentrations continue to decline in the Northeast. This declining trend was also reflected in test positivity which went down from 8.0% to 6.6% in week 2. These consecutive declines in wastewater concentrations and test positivity signal that the Northeast has made it past its RSV seasonal peak.
Influenza: Data through week 3 show that influenza A wastewater concentrations have declined for three consecutive weeks in the Northeast. Influenza B concentrations once again began declining in week 3. As we anticipated, clinical data through week 2 show that hospitalization rates for influenza-like illness declined following decreases in wastewater concentrations in the Northeast, and the majority of states in the Northeast are now in the moderate or low categories. These wastewater and clinical signals suggest that the Northeast has made it through the worst of its influenza season.
COVID-19: The Northeast also experienced a big decline in SARS-CoV-2 wastewater concentrations during week 3, with current concentrations at 1,319 copies/mL. Following declines in wastewater concentration, we are starting to see declines in COVID-19 clinical metrics in the Northeast. During week 2, test positivity declined slightly but remains high, currently between 13-14.8%. In week 2, all but one state (Connecticut) experienced a decrease in hospitalization rates due to COVID-19.
The West
RSV: RSV wastewater concentrations continue to decline in the West during week 3, and remain lower than all other regions. The decreasing trend in test positivity we observed for the previous two weeks in the West has continued, with a reduction from 9.2% to 7.5% in week 2. These declining trends in wastewater and clinical data in the West all bring good news.
Influenza: In the West, wastewater concentrations for influenza A and B continued to decline during week 3. These trends were observed in clinical data as well, where data through week 2 show that most states in the West experienced a decrease in influenza-like illness hospitalization. It appears that the West may have made it through the worst of their influenza season.
COVID-19: SARS-CoV-2 wastewater concentrations declined during week 3, currently at 463 copies/mL. Test positivity also slightly decreased in the West during week 2 and is currently between 8-10.2%. In good news, most Western states experienced a decrease in COVID-19 hospitalization rates, a trend that we hope will continue.
Footnotes:
Wastewater data from Biobot Analytics for RSV, influenza, and SARS-CoV-2 are through January 20, 2024 (MMWR week 3). Clinical data on testing, hospitalizations, and emergency department visits for RSV, influenza, and COVID-19 are from the Centers for Disease Control and Prevention. Updates to clinical data for RSV, influenza, and COVID-19 are through January 13, 2023 (MMWR week 2).