
Summary: Week of 1/8/24
Biobot’s national wastewater network shows that influenza and COVID-19 activity have continued growing nationwide and that RSV activity is beginning to slow in some parts of the country. Despite signs of slowdown for RSV, wastewater concentrations, test positivity, and hospitalizations all remain elevated. Increases in influenza activity were reflected in rising wastewater concentrations and test positivity, culminating in a dramatic jump in the number of influenza hospitalizations during week 52. Although influenza B is also circulating, its prevalence remains low in wastewater and clinical specimens. COVID-19 wastewater concentrations, test positivity, hospitalizations, and deaths all continue to increase across the country.
The Bottom Line: Following the holidays, the three major respiratory illnesses – COVID-19, influenza, and RSV – continue to circulate at very high levels. With such high respiratory illness levels, now is the perfect time to adopt some easy measures to maintain your health and protect those around you from illness. This can include staying home when you’re not feeling well, wearing a mask in crowded spaces, and ensuring you are up to date with your vaccinations.
National Outlook
RSV
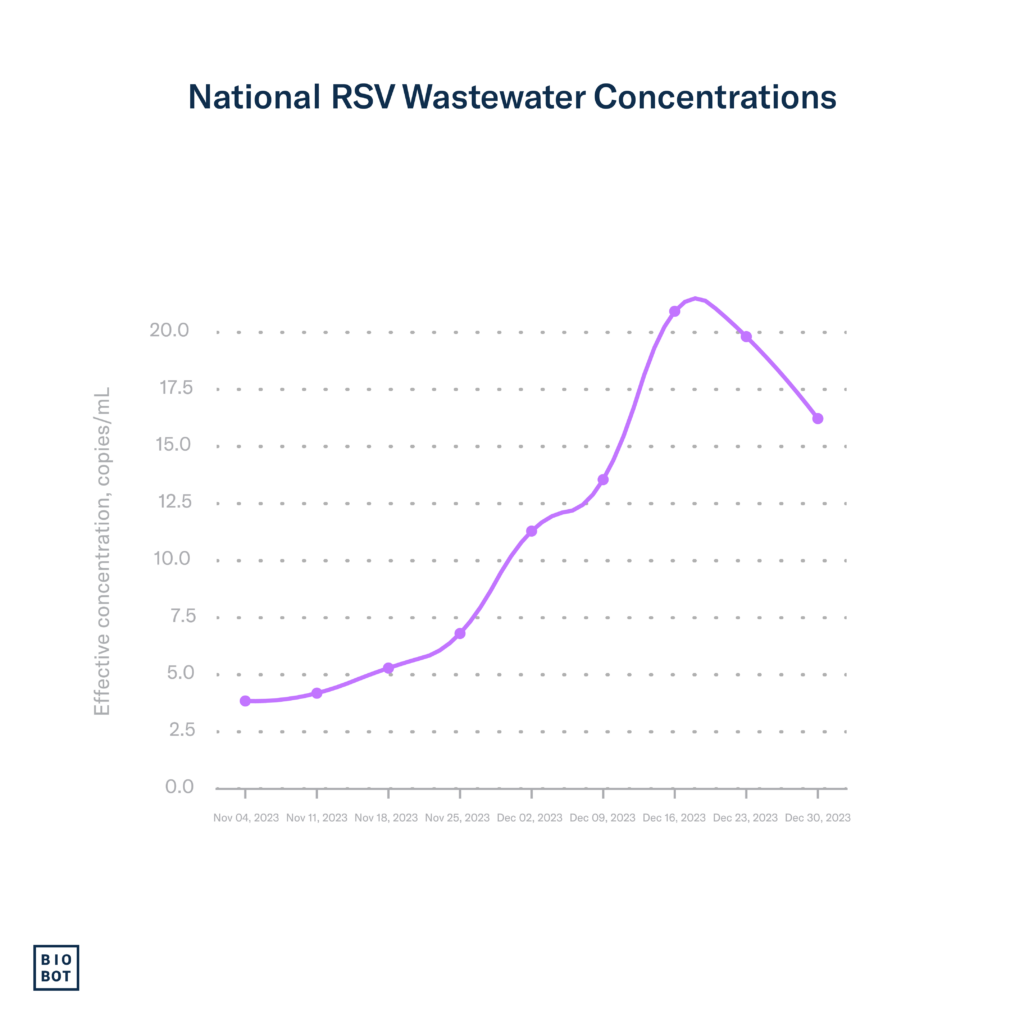
Nationally, RSV wastewater concentrations declined last week but remain high overall. As of December 30th (MMWR week 52), national wastewater data indicates a 13% decrease in RSV concentrations, marking the first week we’ve observed a decrease in national RSV wastewater concentrations.
As of December 30th (MMWR week 52), the percentage of PCR tests that are positive (test positivity) for RSV decreased, going down from 12.1% the previous week to 10.2% currently. For the first time since the beginning of the RSV season, hospitalization rates declined for all age groups. RSV activity still remains quite high, even with recent declines in activity.
Influenza
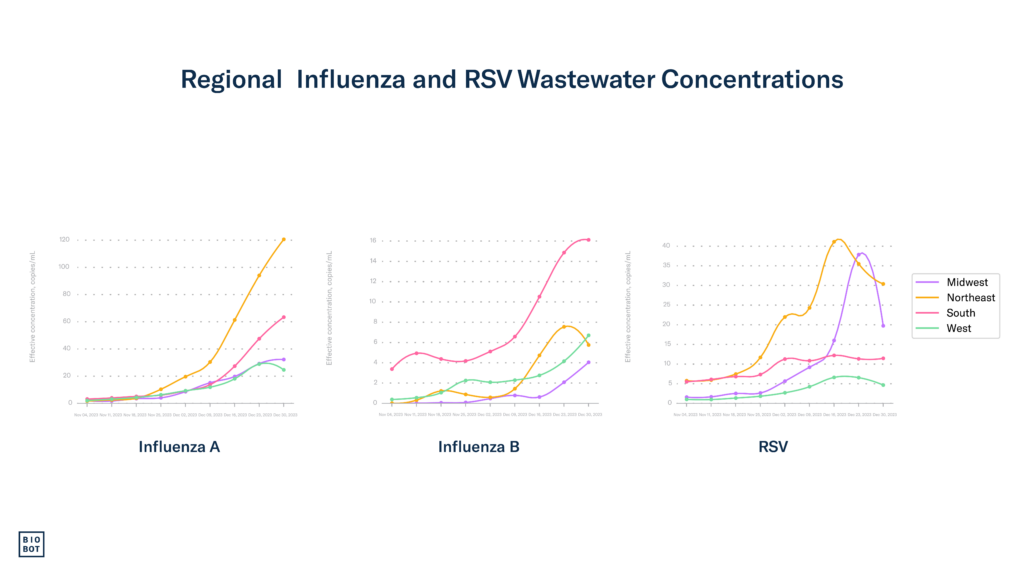
Influenza activity substantially increased across the country, as indicated by wastewater and clinical data. Given the expected impact of holiday travel and gathering, we anticipate sustained high influenza wastewater concentrations and clinical metrics in the coming weeks.
Data as of December 30th show another increase in influenza activity, with influenza A wastewater concentrations up by 28% and influenza B up by 15%. These increases are not as high as the previous week’s changes, suggesting that influenza activity could be starting to slow.
Nationwide, we’re seeing a steady increase in influenza test positivity, currently at 17.5%. The number of hospitalizations due to influenza has more than doubled since our last report, with 20,066 influenza hospitalizations during week 52. The percentage of hospital visits for flu-like symptoms – typical in flu, RSV, and COVID-19 patients – increased to 6.9%. This increase is likely driven by increases in influenza and COVID-19, as it appears that RSV hospitalization rates are beginning to decline.
Most positive flu tests are influenza A, which has consistently been reflected in wastewater data. This indicates that the prevalence of influenza A continues to be much higher than influenza B, which is the typical pattern we see in most US influenza seasons.

COVID-19
COVID-19 activity and community viral load continue to increase, and we expect these trends to continue following holiday travel and gatherings.
Wastewater concentrations for SARS-CoV-2, our earliest indicator for understanding COVID-19 trends, have been increasing across the country over the past eleven weeks. As of January 6th (week 1 for 2024), the national average is 1,298 copies/mL, which is 5% greater than it was the previous week (1,336 copies/mL). The national average concentration is now higher than it was this time last year (~1,059 copies/mL).
As of December 30th, the national COVID-19 test positivity rate increased to 12.4%. Hospitalizations and deaths attributed to COVID-19 show that the disease burden also continues to grow. Nationwide, hospitalizations increased 20.4%, totaling 34,798 admissions during week 52, and the proportion of deaths attributed to COVID-19 increased to 3.6%.
Regional
The South
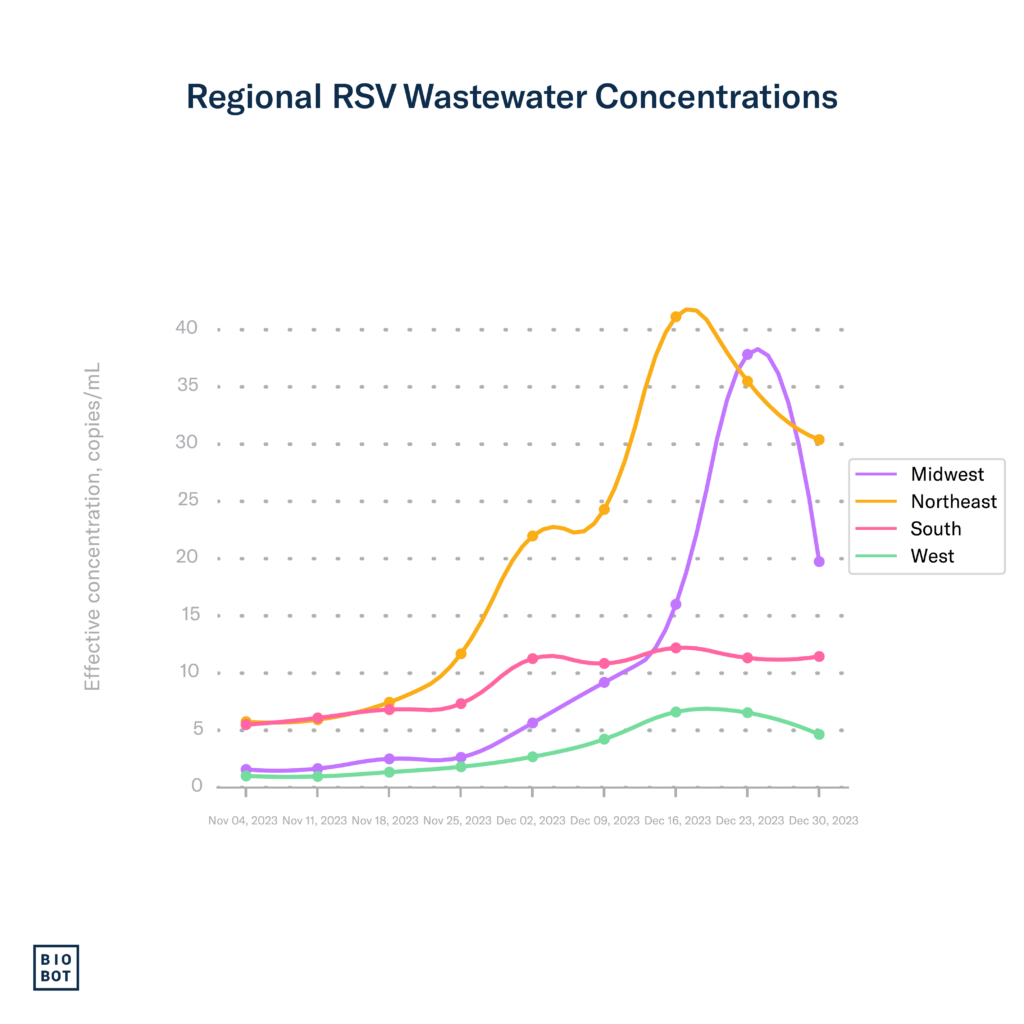
RSV: RSV wastewater concentrations and test positivity remained stable in the South, with test positivity going from 8.9% to 8.2% in week 52. RSV activity in the South remains high.
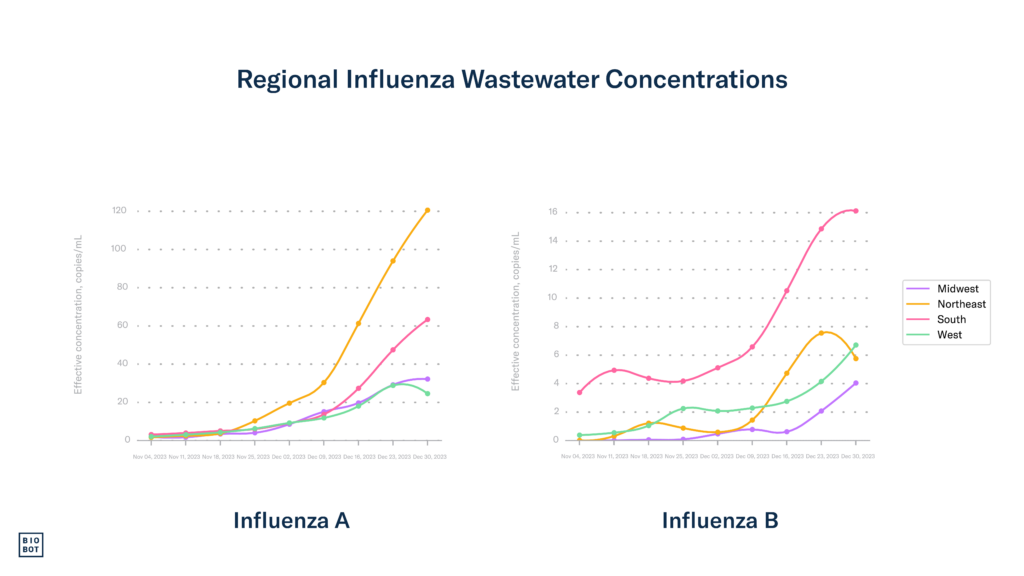
Influenza: The South experienced an increase in wastewater concentrations for influenza A and B, coinciding with the country’s highest rates of influenza-like illness hospitalizations.
COVID-19: Wastewater concentrations slightly increased in the South through January 6th (week 1 for 2024). Although test positivity did not change in the South from week 51 to 52 (currently around 9%), COVID-19 hospitalization rates increased during week 52.
The Midwest
RSV: The Midwest experienced a decline in RSV wastewater concentrations for the first time. Interestingly, this is in contrast to an increase in test positivity which grew from around 13% to 15.1% in the Midwest during week 52. We will be keeping an eye on this to see if these changes are sustained.
Influenza: The Midwest experienced increases in wastewater concentrations for influenza A and B and increases in hospitalizations for influenza-like illness. Several states in the Midwest are now at a high level for influenza-like-illness hospitalizations, with a handful of states remaining in the low category.
COVID-19: SARS-CoV-2 wastewater concentrations remained high and stable in the Midwest from week 52 to week 1, currently at 1,343 copies/mL. Concentrations are now higher in the Midwest than they were this time last year (~747 copies/mL). The Midwest (HHS region 7) continues to have the highest test positivity nationwide, currently at 17.8% for week 52.
The Northeast
RSV: Data through December 30th show that RSV concentrations continued to decline in the Northeast, which was also reflected in a decline in test positivity, currently at 8.9%. These consecutive declines in RSV wastewater concentrations and test positivity in the Northeast signal that they may have made it through the worst of the RSV season but that RSV activity remains high.
Influenza: The Northeast showed the highest concentrations of influenza A again this week, with large increases in wastewater concentrations. This aligns with clinical data showing that most states in the Northeast are in the high or very high influenza-like-illness hospitalization category.
COVID-19: The Northeast now has the highest SARS-CoV-2 wastewater concentrations in the country, marking substantial increases from the previous week. Current concentrations (2,611 copies/mL) are now higher than they were this time last year in the Northeast (~1,584 copies/mL). These increases were also reflected in clinical data, as test positivity grew in the Northeast and is currently around 14%.
The West
RSV: RSV wastewater concentrations slightly declined in the West. The West experienced a big drop in RSV test positivity during week 52, going from 12.8% to 8.8% currently. We will be keeping an eye on these trends to see if they are sustained next week, which could be a welcome signal that the West has made it through the worst of the RSV season.
Influenza: In the West, wastewater concentrations for influenza A slightly declined while concentrations for influenza B increased. Clinical data show that most states in the West are in the high or very high influenza-like-illness hospitalization category. We are keeping an eye on the West to see if these slight changes in influenza A activity are sustained in the coming week.
COVID-19: SARS-CoV-2 wastewater concentrations slightly declined in the West. The West experienced slight increases in test positivity but remains the lowest in the country, currently between 8-10.3%. Overall, the West appears to have had fewer extreme changes in wastewater and clinical data compared to other parts of the country this season so far.
Footnotes:
Wastewater data from Biobot Analytics for RSV and influenza are through December 30, 2023 (MMWR week 52), and wastewater data for SARS-CoV-2 are through January 6, 2024 (MMWR week 1). Clinical data on testing, hospitalizations, and emergency department visits for RSV, influenza, and COVID-19 are from the Centers for Disease Control and Prevention. Updates to clinical data for RSV, influenza, and COVID-19 are through December 30th, 2023 (MMWR week 52).