

Summary: Week of 3/4/24
Data from Biobot’s national wastewater network and clinical disease monitoring show that SARS-CoV-2 activity continues to decline at a good pace, while RSV and influenza activity have slowed in their declines. National average wastewater concentrations for SARS-CoV-2 declined during week 9, while influenza concentrations only slightly declined, remaining at a relatively high level. RSV wastewater concentrations did not change in week 9. While most clinical metrics for the three major viruses showed some signals of declining respiratory illness burden, there are a couple of influenza metrics that did not decline. The signals we are seeing from RSV and COVID-19 are heading in the right direction towards low activity, while influenza appears to be lingering, resulting in a long flu season this year.
The Bottom Line: As we approach the end of the respiratory virus season, viral activity levels remain elevated, especially for influenza. It is still important to reduce contact with others if you are feeling ill, consider wearing a mask in crowded environments, and keep up to date with vaccines and boosters. These measures can help keep you and your loved ones healthy.
National Outlook
RSV
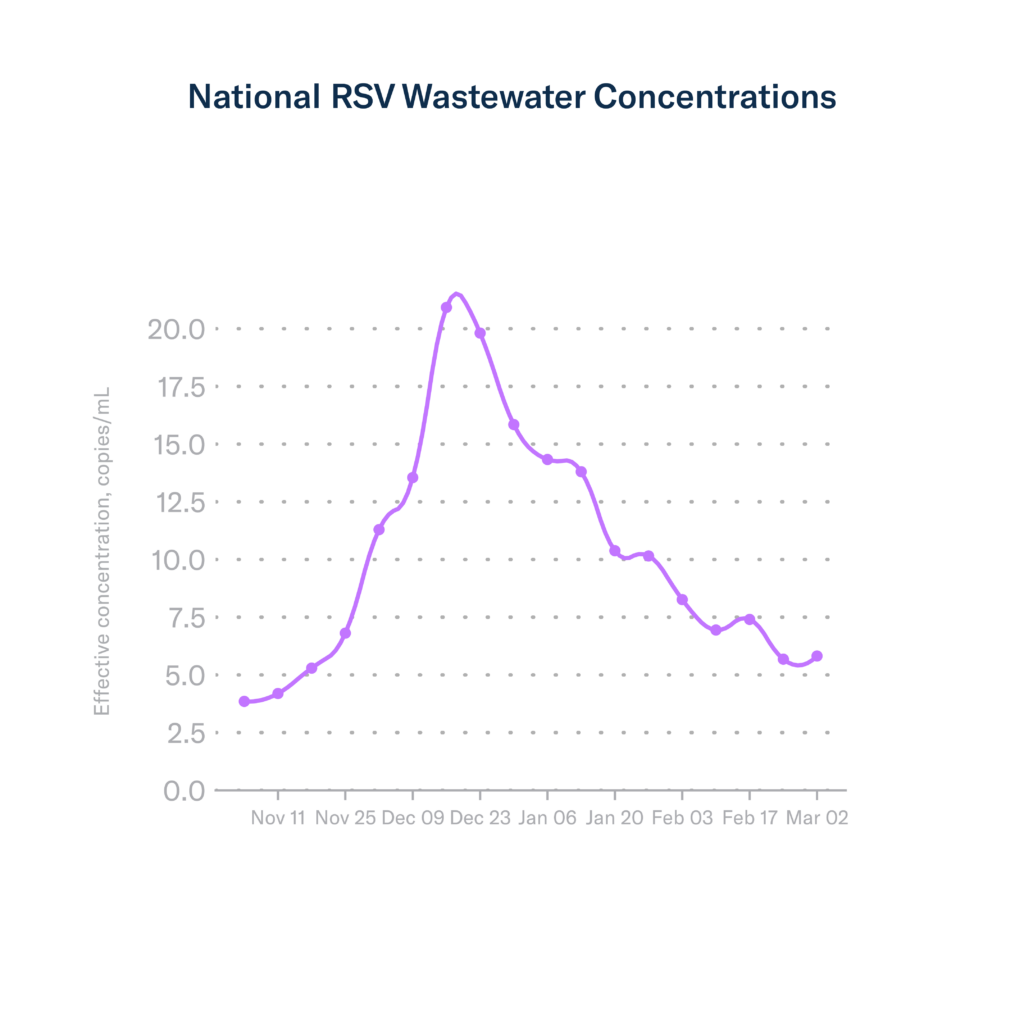
Nationally, RSV wastewater concentrations did not change from week 8 to week 9 (March 2nd). RSV concentration averages remain at the levels we observed in mid-November.
Clinical RSV metrics also continued to decline as of February 24th (week 8). In week 8, the percentage of positive PCR tests (test positivity) for RSV continued to decrease, going down from 4.3% the previous week to 3.8%. Hospitalization rates also continue to decline nationally and for all age groups.
Influenza
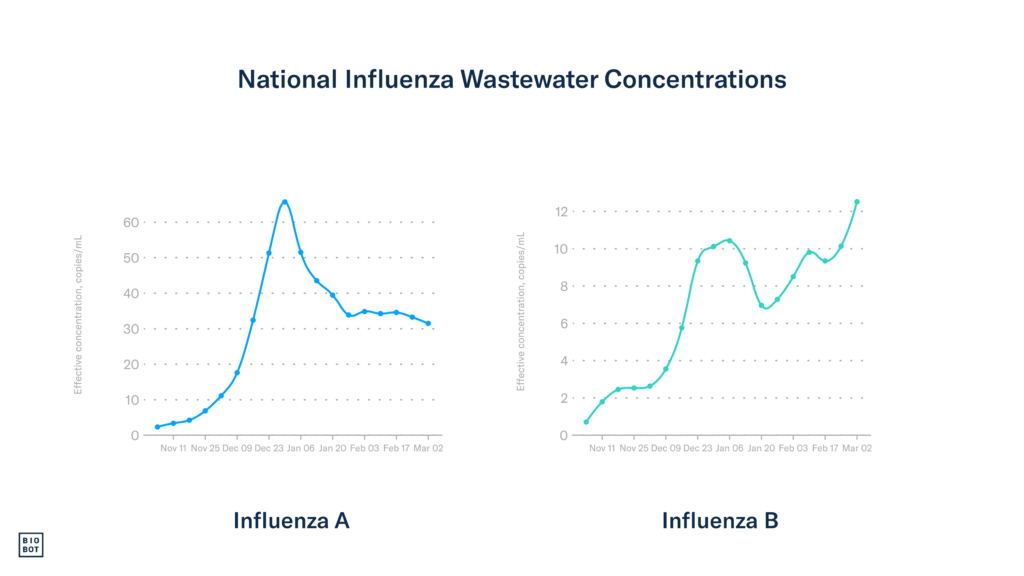
Data through week 9 show that wastewater concentrations for influenza A, which is driving most clinical burden in the US, declined slightly, going down by 5.4%. Influenza B concentrations, however, increased during week 9 and remain high.
Clinical influenza metrics have remained mostly steady over the past couple of weeks, indicating that the disease burden due to influenza remains elevated. In some good news, test positivity declined again during week 8, going from 14.8% in week 7 to 14.2% currently. The number of hospitalizations remained consistent again, with 10,148 hospitalizations due to flu during week 8. The percentage of outpatient visits for flu-like symptoms – typical in flu, RSV, and COVID-19 patients – also did not change, remaining at 4.4% in week 8. The small declines in wastewater concentrations and moderately high clinical metrics that we observe suggest that influenza activity persists late into the respiratory virus season and that we likely have at least a few more weeks of elevated flu activity.
COVID-19
Wastewater data show that COVID-19 activity and community viral load decreased again in the previous week. As of week 9, the national SARS-CoV-2 wastewater concentration average is 605 copies/mL.
In great news, all of the major national clinical COVID-19 metrics are continuing to trend downward during week 8. COVID-19 hospitalizations dropped from around 19,000 in week 7 to around 17,300 in week 8. The national COVID-19 test positivity rate declined from 8.1% in week 7 to 7.4% in week 8. Deaths also continued to decline, going down by 8.7%, currently representing 2.1% of deaths in the US. These downward trends in wastewater concentration and clinical metrics are great news and indicate that we continue to move in the right direction toward the end of this COVID-19 surge.
Regional
The South
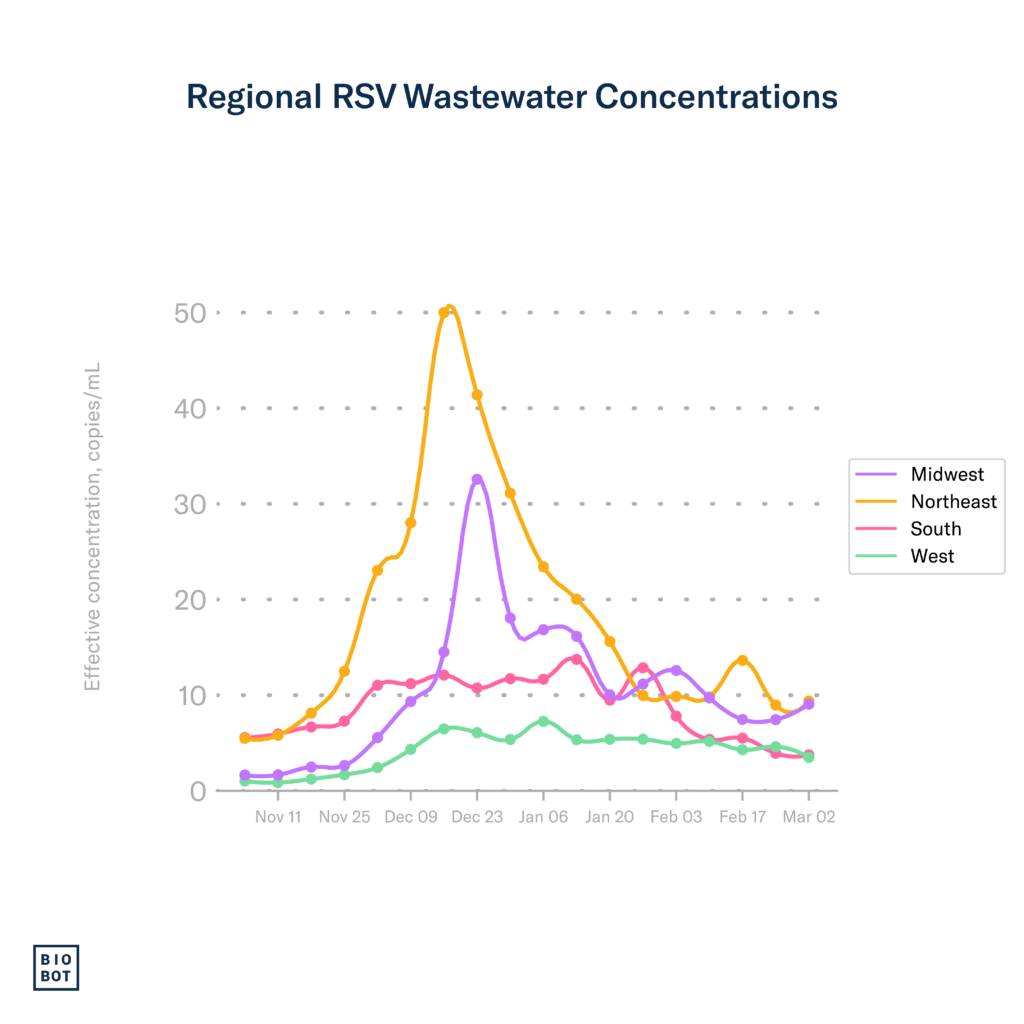
RSV: In the South, RSV wastewater concentrations were consistent and remained low in week 9. Concentrations are now lower than they were when we began testing in late October. During week 8, RSV test positivity levels continued to decline, currently at 2%. This value is similar to what we saw at the beginning of the RSV season in early September, signaling that RSV activity in the South is low.
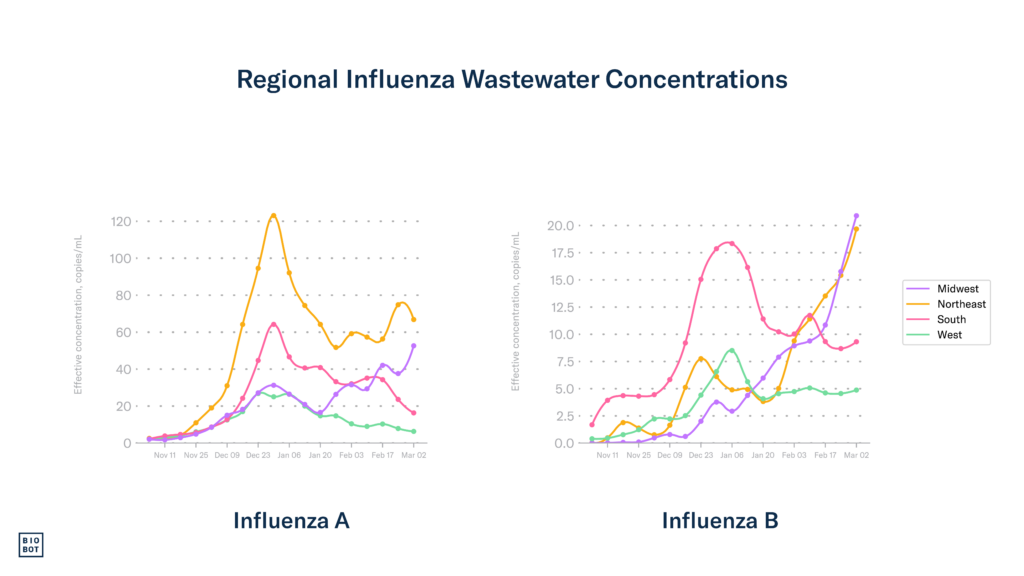
Influenza: Influenza A wastewater concentration continued to decline in the South during week 9, while influenza B concentrations slightly increased. While a handful of Southern states saw increases in influenza-like illness outpatient visits in week 8, most saw decreases. Despite these positive trends, most states in the South remain at a High or Very High ILI activity level.
COVID-19: SARS-CoV-2 wastewater concentrations remained stable in the South during week 9, currently at 546 copies/mL. The number of states reporting increases in hospitalizations decreased in the South during week 8, with 3 states reporting small increases (Arkansas, Kentucky, and West Virginia). All other Southern states experienced decreases or no change in hospitalizations. These trends suggest that the South is heading in the right direction with declining COVID-19 activity.
The Midwest
RSV: RSV wastewater concentrations slightly increased in the Midwest during week 9, and they are currently at similar levels observed in early December. Test positivity during week 8 continued to decline, dropping down to 5.4%. The Midwest continues to have the highest RSV test positivity in the country, and it appears the RSV activity is holding out for a bit longer. We’ll continue to keep an eye on the Midwest and hope that RSV starts declining again soon.
Influenza: Following a brief dip, influenza A wastewater concentrations unfortunately began increasing again in the Midwest during week 9. Influenza B concentrations also continued to increase in week 9. Clinical data corroborates these findings and shows that the Midwest’s respiratory disease burden is still quite elevated. During week 8, most states in the Midwest saw an increase in influenza-like illness outpatient visits, with Iowa, Nebraska, and Michigan having the largest increases. Ohio and Michigan also remain at the Very High ILI activity level. We hope that these trends will reverse their direction soon.
COVID-19: SARS-CoV-2 wastewater concentrations slightly increased in the Midwest during week 9, currently at 895 copies/mL. Following recent increases in SARS-CoV-2 wastewater concentrations, we are also starting to observe some increases in the COVID-19 clinical burden in the Midwest. During week 8, a higher number of states (five) reported increases in COVID-19 hospitalizations compared to last week. Nebraska especially experienced a large increase in hospitalizations. We will keep an eye on COVID-19 in the Midwest.
The Northeast
RSV: RSV wastewater concentrations in the Northeast did not change during week 9, and levels remain low. RSV test positivity continued to decline during week 8, currently at 2.7%. These are good signs that RSV activity remains low in the Northeast.
Influenza: In good news, influenza A concentrations began decreasing again in the Northeast during week 9. Unfortunately, influenza B concentrations increased significantly compared to last week. Clinical metrics remained mostly stable during week 8 in the Northeast, but a couple of states, including Pennsylvania and New Jersey, reported slight increases in influenza-like illness outpatient visits. Unfortunately, Massachusetts, Rhode Island, Maine, and New Jersey remain at the High ILI activity level.
COVID-19: In great news, the Northeast experienced a big decline in SARS-CoV-2 wastewater concentrations during week 9, with current concentrations at 737 copies/mL. The Northwest also continues to show some good signs of continued decline in COVID-19 disease burden, with all but two states (Maine and Delaware) experiencing a decrease in COVID-19-associated hospitalizations during week 8.
The West
RSV: RSV wastewater concentrations declined in the West during week 9 and are now at levels observed in early December. RSV test positivity also continued to decline in the West during week 8, currently at 3.6%. These are great signals that the West is nearing the end of its RSV season.
Influenza: Wastewater concentrations for influenza A continued decreasing in the West during week 9 and are now at similar levels to those observed in late November. Influenza B concentrations did not change during week 9. Clinical metrics in the West during week 7 are a mixed bag again, with about half of the states experiencing slight increases in influenza-like illness outpatient visits and half experiencing slight decreases or no change. New Mexico remains in the Very High ILI category, and Wyoming and Idaho remain in the High category. We hope to see clinical trends follow the decreases in wastewater concentrations we observed in week 9.
COVID-19: SARS-CoV-2 wastewater concentrations continued to decline in the West during week 9, currently at 317 copies/mL. Most Western states experienced a decrease in COVID-19-associated hospitalizations during week 8, while Idaho, Oregon, and Montana experienced increases. These trends in the West continue to head in the right direction towards the end of this COVID-19 surge.
Footnotes:
Wastewater data from Biobot Analytics for RSV, influenza, and SARS-CoV-2 are through March 2, 2024 (MMWR week 9). Clinical data on testing, hospitalizations, and emergency department visits for RSV, influenza, and COVID-19 are from the Centers for Disease Control and Prevention. Updates to clinical data for RSV, influenza, and COVID-19 are through February 24, 2024 (MMWR week 8).