
Summary: Week of 11/27/23
The respiratory illness season is now in full swing across the US. Biobot’s wastewater data shows active and increased co-circulation of RSV, influenza, and SARS-CoV-2. Clinical data shows that RSV transmission continues to be high. Influenza transmission is picking up, particularly in the South and West, with most infections thus far stemming from influenza A. Influenza B circulation is also increasing as seen in wastewater data and clinical tests. Wastewater and hospitalization data show that SARS-CoV-2 activity is also on the rise again, and we expect there to likely be more hospitalizations and emergency department visits occurring over the next couple of weeks.
The Bottom Line: Respiratory illness season is in full swing and has not yet peaked. With the holiday season also underway – where we travel to gather and celebrate with loved ones – it is a good time to think about taking steps, like staying home if you are sick or getting vaccinated, to keep yourself and loved ones healthy.
RSV
RSV transmission is currently high and continues to increase.
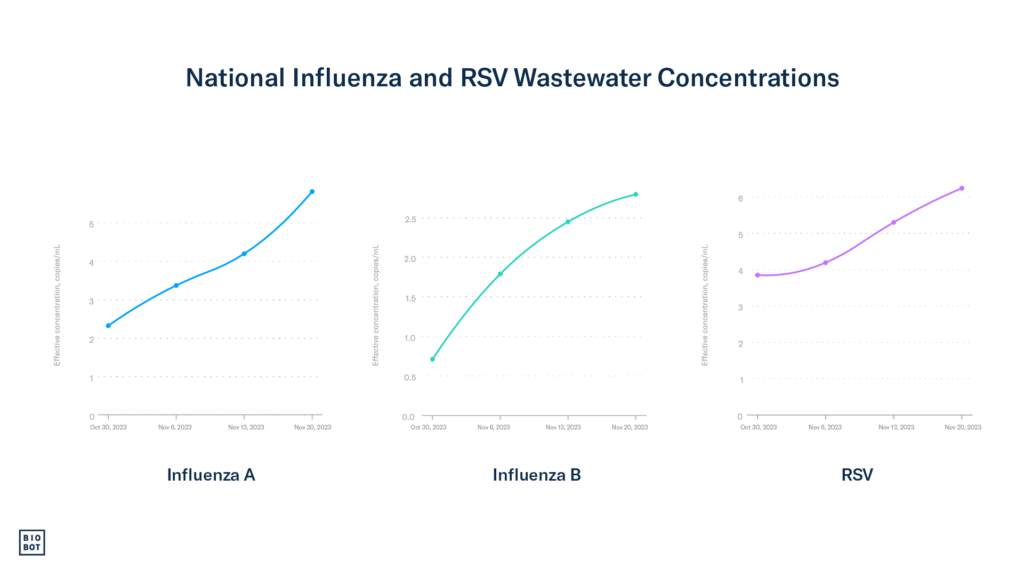
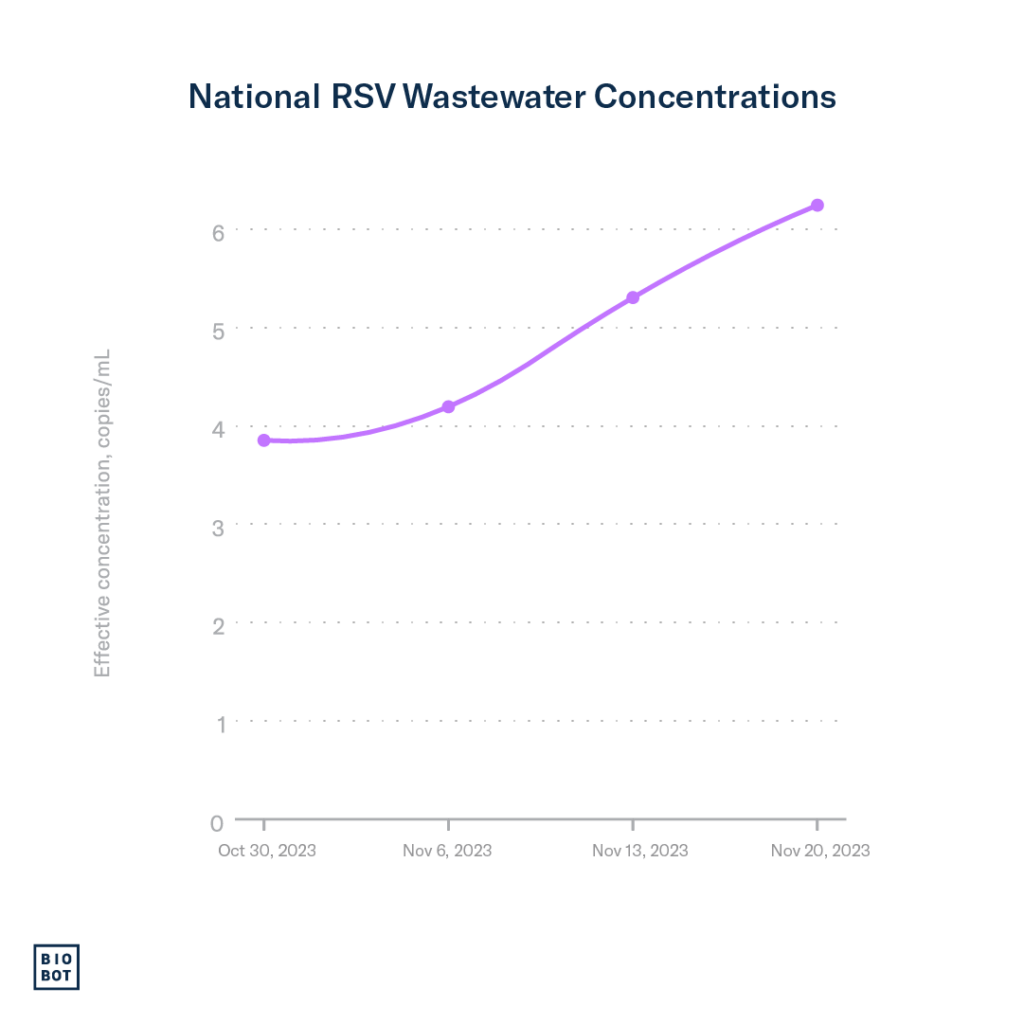
Wastewater data: Using Biobot’s national network of sample providers, we began testing for RSV in wastewater across the country in October and, since then, the concentration of RSV has been steadily increasing. Data through November 25th show wastewater concentrations for RSV continuing to increase most rapidly in the South and Northeast regions, with the Midwest showing a slight uptick.
Clinical data: The prevalence of RSV is on the rise, both in terms of the number and percentage of positive tests for RSV, with the current national positive PCR detection percentage at about 13%, up from 11% in our last report. While hospitalization rates for young children under 4 years old and for individuals aged 65 years and older may be showing signs of slowing, they remain high. Concurrently, the percentage of hospital visits for flu-like symptoms – common among flu, RSV, and COVID-19 patients – has increased from 3.5% to 3.9%.
Southern parts of the US continue to be hit the hardest with RSV, evident in clinical and wastewater data. The percentage of positive PCR tests for RSV in the south has reached 21%, up from 19%, markedly higher than the national average of 13%. The Northeast region is also experiencing increased levels of RSV activity, with about 14% of PCR tests positive. All other regions also experienced increases in the percentage of PCR tests positive for RSV this week.
Contrary to trends around this time last year, when RSV hospitalizations had already peaked, current clinical and wastewater data suggest sustained increases in RSV activity. The percentage of positive tests, hospitalizations, and wastewater concentrations are all still high, suggesting that the peak of the RSV season may still be ahead of us.
Influenza
Whereas last week’s clinical and wastewater data hinted that the influenza season was just beginning, this week’s data indicates that influenza activity is picking up.
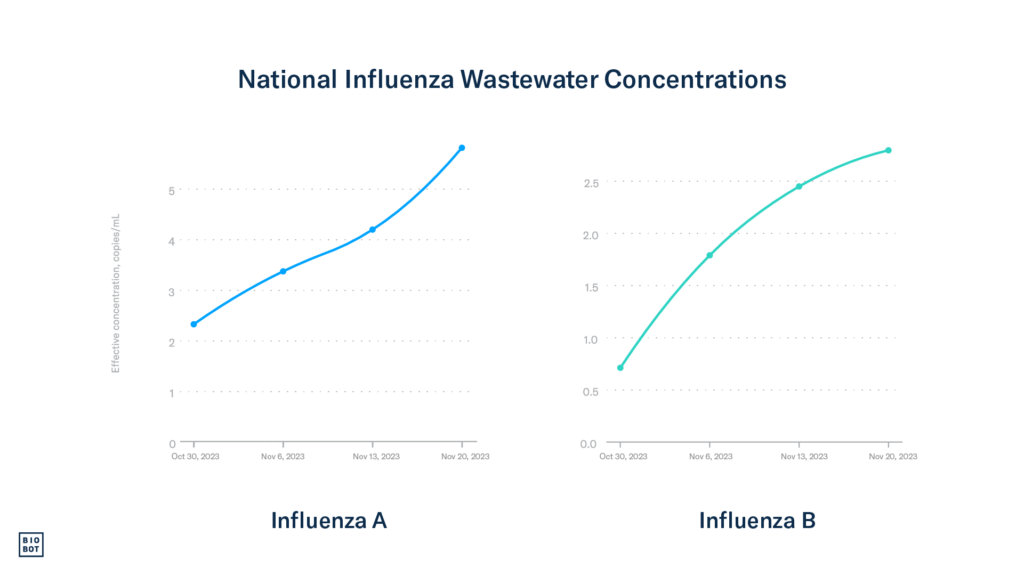
Wastewater data: Using Biobot’s national network of sample providers, we began testing for influenza types A and B in wastewater across the country in October, and since then, wastewater concentrations have continued to steadily increase. Data through November 25th show influenza A and influenza B wastewater concentrations increasing. Wastewater concentrations for influenza A are currently increasing most rapidly in the Northeast and West regions, with the Midwest showing a slight uptick (similar to RSV).
Clinical data: Nationally, clinical data show that influenza transmission is on the rise, with an increasing percentage of positive tests – currently standing at 6.2%, up from 4% in our last report. Concurrently, weekly flu-related hospital admissions are on the upswing. The percentage of hospital visits for flu-like symptoms, a commonality among flu, RSV, and COVID-19 patients, has also seen an uptick from 3.5% to 3.9%.
Similar to RSV, the South is feeling the brunt of the effects. They have more hospital visits for flu-like symptoms than other parts of the country, indicating a higher level of flu activity compared to other areas. Recently, the West also started showing higher levels of influenza-like-illness activity.
Most of the positive flu tests continue to be positive for influenza A, which tracks what we’re finding in wastewater samples. This suggests that influenza A is being transmitted more than influenza B at the moment.
COVID-19
SARS-CoV-2 activity and community viral load are increasing – currently, there are more hospitalizations and deaths for COVID-19 than for flu or RSV.
Wastewater data: Wastewater concentrations for SARS-CoV-2, our earliest indicator for understanding transmission trends, have been increasing across the country over the past five weeks. As of November 25, the national average is 553 copies/mL, which is 11.5% greater than it was last week (446 copies/mL). The national average concentration is currently lower than it was this time last year (~723 copies/mL). Wastewater concentrations are currently highest in the Midwest at 871 copies/mL.
Clinical data: As of November 18th, the most recent week with available CDC SARS-CoV-2 data, the percentage of SARS-CoV-2 tests that are positive has remained stable at 8.2% nationwide, compared to 8.4% in our last report. Percent positivity remains highest, and is currently increasing, in HHS region 7 (the Midwest), at about 14.1%. Hospitalization rates for COVID-19 have increased by about 10%, resulting in 18,000 hospitalizations.
While it appears that the percentage of positive tests has plateaued over the past couple of weeks, and the number of people visiting the hospital or emergency department for COVID-19 has started inching up. With additional evidence of increases in SARS-CoV-2 wastewater concentrations, we expect to see test positivity, emergency department visits, and hospitalizations increase over the next couple of weeks.
Footnotes:
Clinical data on testing, hospitalizations, and emergency department visits for RSV, influenza, and SARS-CoV-2 are from the Centers for Disease Control and Prevention. Updates to clinical data for influenza and RSV are through November 25, 2023 (epidemiologic week 47). Updates to clinical data for SARS-CoV-2 are through November 18, 2023 (epidemiologic week 46).