
Summary: Week of 11/20/23
The respiratory illness season has begun in earnest in the U.S. Biobot wastewater data shows that active circulation of RSV, influenza, and SARS-CoV-2 are co-occurring and concentrations are increasing for all three. Clinical data shows that RSV transmission is high, having had another early start to the season this year. Influenza transmission is also picking up, with most infections thus far stemming from influenza A. Influenza B circulation is also increasing as seen in wastewater data and clinical tests. Wastewater data shows that SARS-CoV-2 concentrations are also on the rise again, and we expect there to likely be more hospitalizations and emergency department visits occurring over the next couple of weeks.
The Bottom Line: As we head into the holiday season in which we travel to gather and celebrate with loved ones, now is a great time to get vaccinated for influenza and SARS-CoV-2, and RSV if you are eligible.
RSV
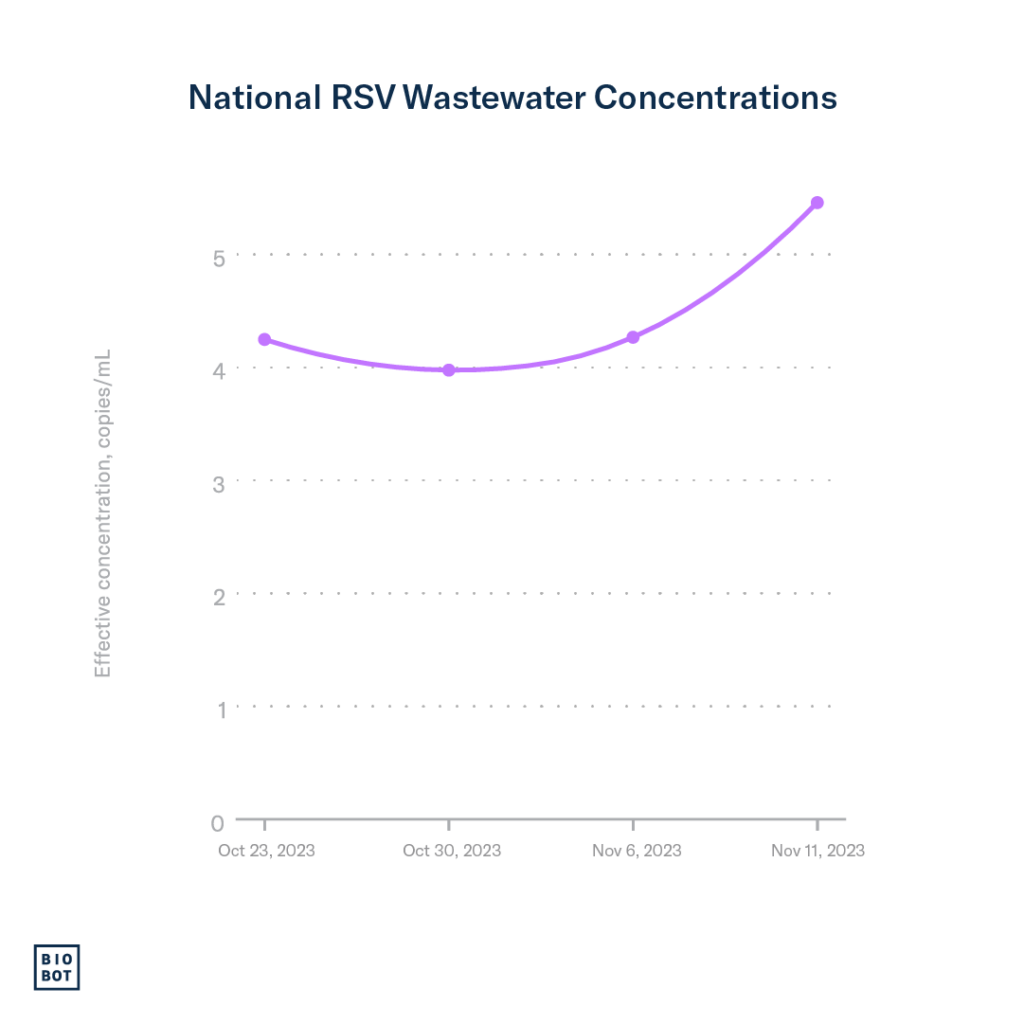
The RSV season started early again this year and transmission is currently high and increasing.
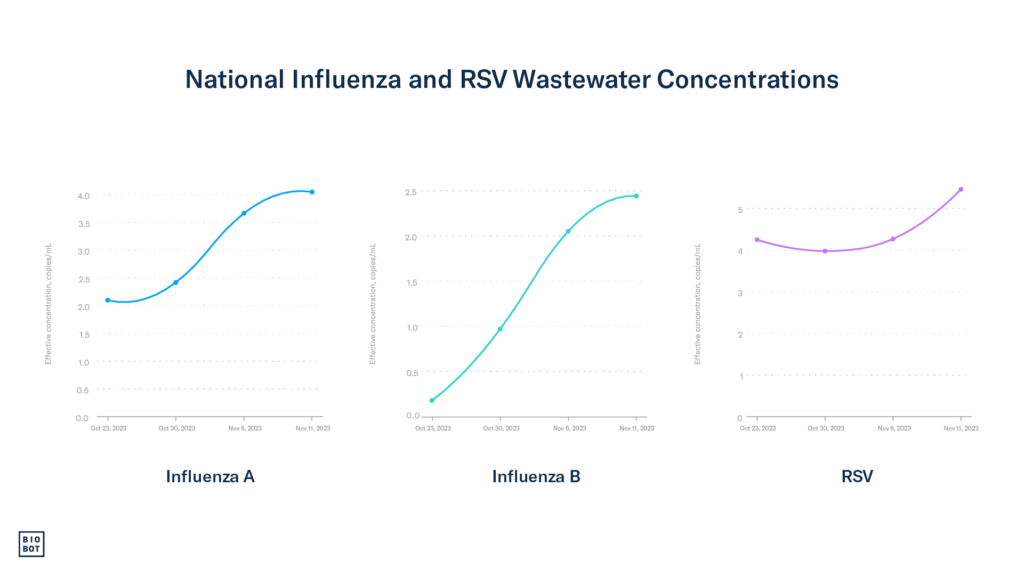
Wastewater data: Using Biobot’s national network of sample providers, we began testing for RSV in wastewater across the country in October, and since then, the concentration of RSV has been steadily increasing. Wastewater concentrations for RSV are increasing most rapidly in the South and Northeast regions.
Clinical data: This year hospitals and clinics have seen patients testing positive for RSV earlier than normal, and the number of positive tests and percent of positive tests are also going up (the current percent of PCR detections is about 11% nationally). Additionally, the number of people visiting the hospital for flu-like symptoms (common among both flu and RSV sufferers) is also increasing. Young children and adults over 65 years old currently have the highest rates of hospitalization from RSV infections.
Southern parts of the US are being hit the hardest with RSV currently, as seen in clinical and wastewater data. The percent of PCR tests that are positive for RSV in the south is now 19%, much higher than the national average of 11%. In some southern states, hospitalizations for RSV are also higher than they were at this time last year.
Influenza
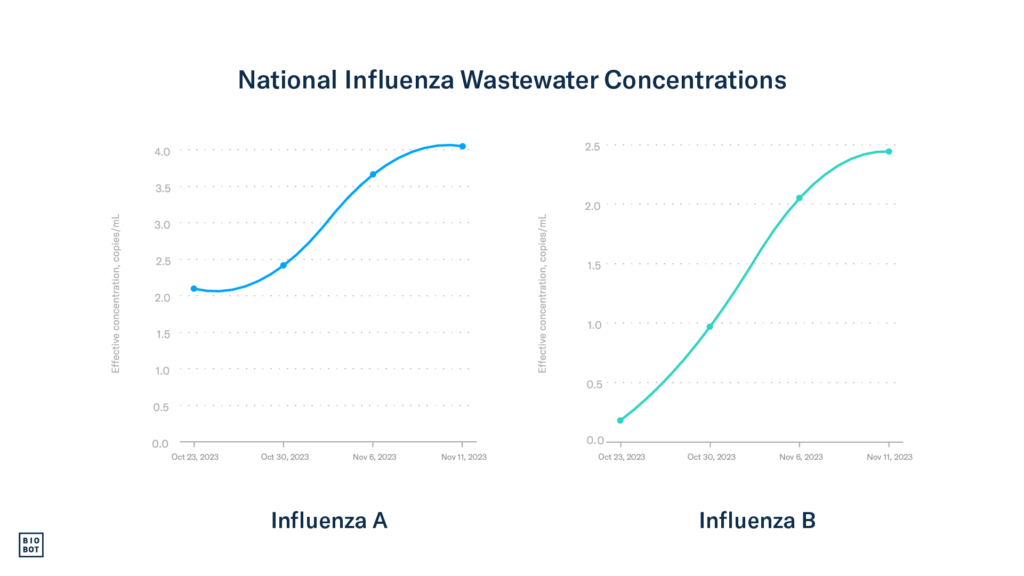
Influenza virus transmission in the US is increasing, signaling that the flu season has started.
Wastewater data: Using Biobot’s national network of sample providers, we began testing for influenza types A and B in wastewater across the country in October, and since then, wastewater concentrations have been steadily increasing. In particular, we are seeing more influenza A in wastewater, however, our detections of influenza B have also been increasing over the past week. Wastewater concentrations for influenza A are currently increasing most rapidly in the South region.
Clinical data: More people are testing positive for the flu, and the percentage of positive tests is rising (currently 4%). This is happening nationwide, and the number of people going to the hospital for flu-like symptoms has surpassed the level that the Centers for Disease Control and Prevention (CDC) considers the start of the respiratory season.
Similar to RSV, the south is feeling the brunt of the effects. They have more hospital visits for flu-like symptoms than other parts of the country, indicating a higher level of flu activity compared to other areas.
Right now, most of the positive flu tests are positive for influenza A, which tracks what we’re finding in wastewater samples. This suggests that influenza A is being transmitted more than influenza B at the moment.
COVID-19
SARS-CoV-2 activity and community viral load are increasing – currently, there are more hospitalizations and deaths for COVID-19 than for flu or RSV.
Wastewater data: Wastewater concentrations for SARS-CoV-2, our earliest indicator for understanding transmission trends, have been increasing across the country over the past three weeks. The national average is 444 copies/mL, which is 18% greater than it was in mid-October (376 copies/mL). The national average concentration is currently slightly lower than it was this time last year (~550 copies/mL). Wastewater concentrations are currently highest in the Midwest at 587 copies/mL.
Clinical data: The percent of SARS-CoV-2 tests that are positive is 8.4% nationwide. Percent positivity is highest in HHS region 7 (the Midwest), at about 13.4%.
It appears that the percent of positive tests and the number of people visiting the hospital or emergency department for COVID-19 has plateaued over the past couple of weeks. Because the concentration in wastewater is increasing, we expect to see test positivity, emergency department visits, and hospitalizations increase over the next couple of weeks.
Footnotes:
Clinical data on testing, hospitalizations, and emergency department visits for RSV, influenza, and SARS-CoV-2 are from the Centers for Disease Control and Prevention.