Blog
Why Wastewater was a Leading Indicator of the Omicron Surge

February 22, 2022


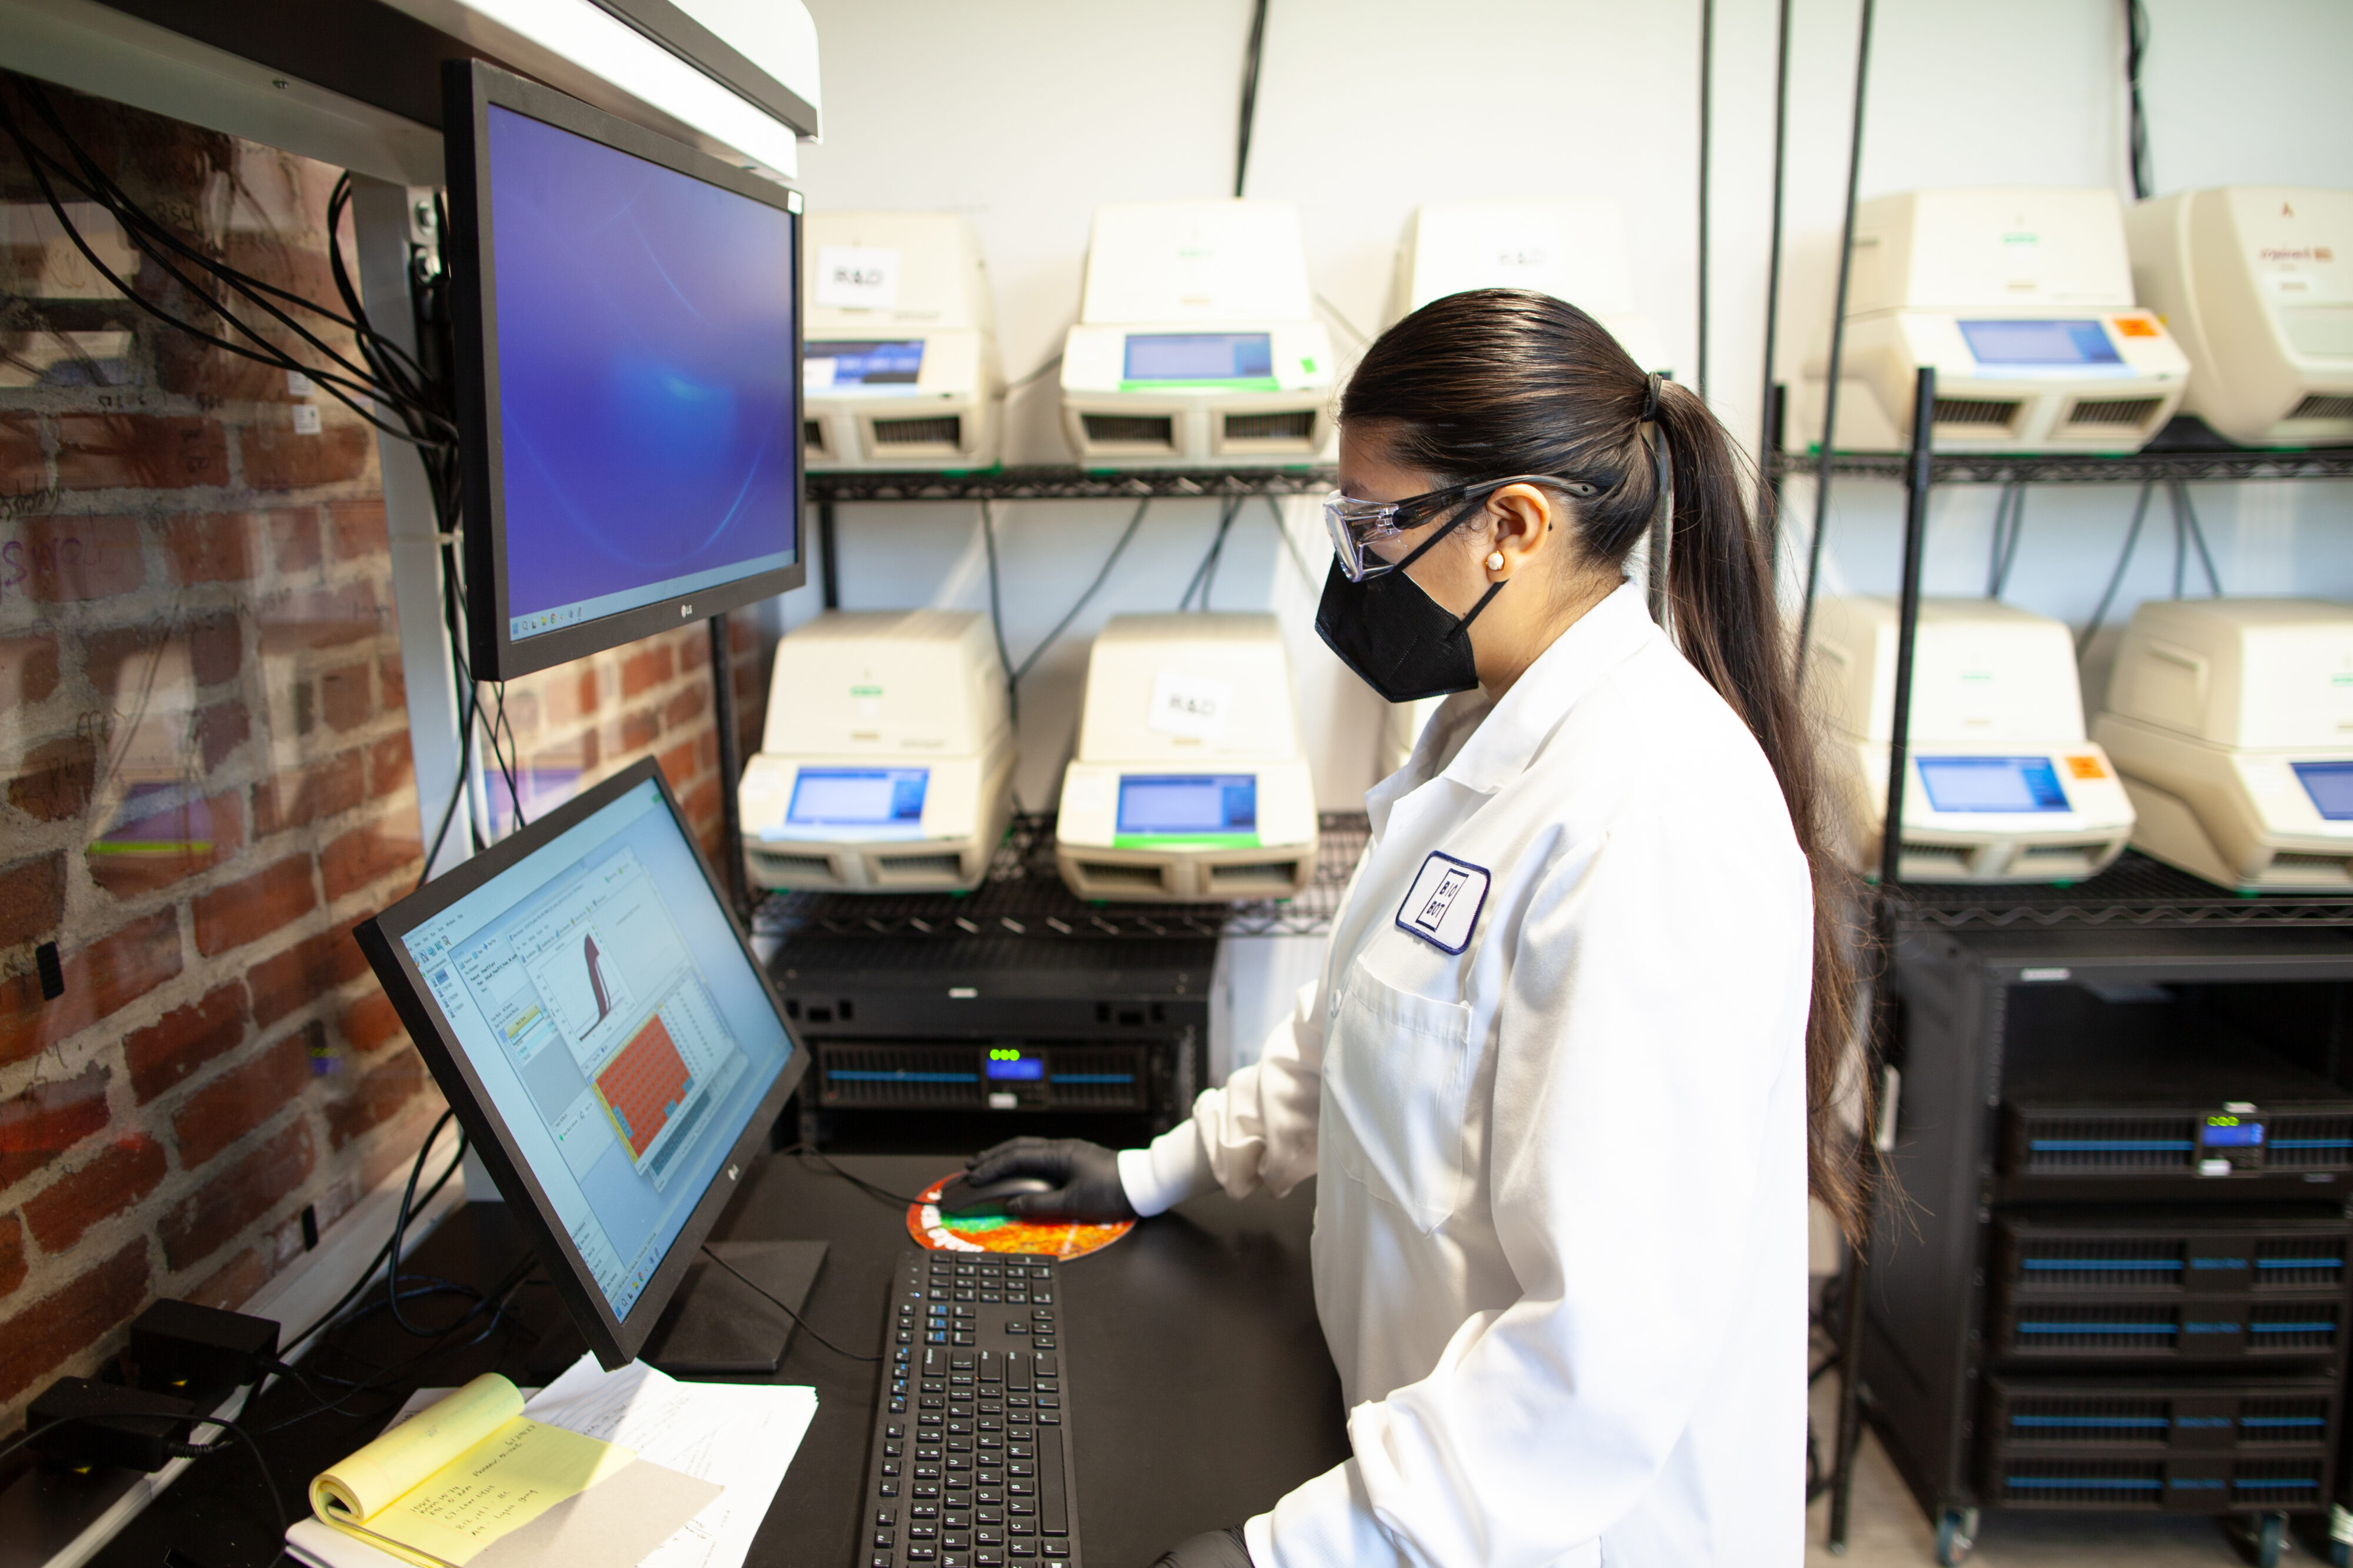
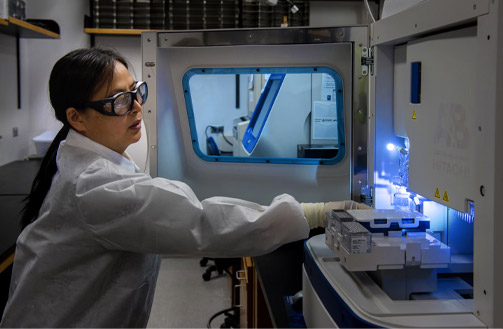
Since the beginning of the pandemic, wastewater-based epidemiology (WBE) has been used as a powerful tool to obtain reliable data about COVID-19 trends, prevalence, and variant spread. With the repeated emergence of new SARS-CoV-2 variants around the world, turning to the sewers for a better understanding of this rapidly changing virus has again proven illuminating. Wastewater data generated by Biobot during the Omicron winter wave yielded a number of interesting insights.
First, we observed a few similarities to previous waves. As highlighted in the press, rising levels of SARS-CoV-2 in wastewater preceded and even predicted an increase in Omicron cases. Later on, wastewater data also forecasted a decrease in Omicron cases.

Wastewater data became even more important as Omicron infections went unreported
However, we also saw notable differences. At-home testing became more widely available, offering an alternative to overwhelmed testing centers. In addition, many individuals infected with Omicron experienced milder symptoms when compared to previous variants.
“So while Omicron resulted in the most clinical cases reported, these differences contributed to the large gap we saw between the peak number of clinical cases (~3x higher than last winter) and the peak viral concentrations in wastewater (7-8x higher than last winter),” Lead Epidemiologist Scott Olesen, PhD explains.
In other words, there was far more undercounting during the Omicron wave than during the Alpha or Delta surges. Wastewater data was therefore a better estimate of total infections, offering an accurate and reliable way to understand the spread and activity of SARS-CoV-2, independent of clinical reporting.

Source: Biobot Analytics, unpublished data
As COVID-19 becomes endemic Wastewater data becomes a significant leading indicator
What’s more — the lag time between peak wastewater and peak cases was long! In the greater Boston area, for example, Omicron levels in wastewater peaked on New Years Day, but it took another two weeks before clinical cases peaked and began to fall. This meant that wastewater data was falling for almost 14 days before cases in the Boston area peaked.

Source: Biobot Analytics, unpublished data
This window of time between peaks highlights wastewater as a leading indicator, and provides another great example of how valuable wastewater data can be when trying to predict and plan for an increase in clinical cases (and the resulting burden on health care systems). In Boston, hospitals proactively suspended elective surgeries (before cases peaked) based on the insights from wastewater data.

Source: Biobot Analytics, unpublished data
Taking what we learned about wastewater during this wave for future variant monitoring
For variants like Omicron that are highly infectious but less symptomatic, wastewater data provides an estimate of the total number of people infected, whether symptomatic or asymptomatic, and continues to be a leading indicator that complements reported clinical data. As reported cases continue to decline, and testing fatigue dominates, continued wastewater monitoring ensures we are ready for the emergence of future variants.
Written by Biobot Analytics
Biobot provides wastewater epidemiology data & analysis to help governments & businesses focus on public health efforts and improve lives.